
JDK 25, to be released on September 16, is set to include three new Java Enhancement Proposals (JEPs) for JFR and several enhancements to the jdk.jfr API and the jfr command.
JEP 518: JFR Cooperative Sampling
JEP 518: JFR Cooperative Sampling reworks the method sampling mechanism in the HotSpot JVM. Stack walking now happens from a safepoint, but without the safepoint bias that JVM TI-based profilers suffer from. The result is safer stack walking with ZGC and a more scalable method sampler that supports concurrent stack walking. The JEP also adds a new event, SafepointLatency, which records the time it takes for a thread to reach a safepoint. You can enable it on the command line as follows:
$ java -XX:StartFlightRecording:jdk.SafepointLatency#enabled=true,filename=r.jfr
$ jfr print --events jdk.SafepointLatency r.jfr
jdk.SafepointLatency {
startTime = 23:57:39.856 (2025-05-31)
duration = 0.0283 ms
threadState = "_thread_in_Java"
eventThread = "AWT-EventQueue-0" (javaThreadId = 32)
stackTrace = [
  sun.java2d.marlin.MarlinTileGenerator.getAlphaNoRLE(byte[], int) line: 268
  sun.java2d.marlin.MarlinTileGenerator.getAlpha(byte[], int, int) line: 193
  sun.java2d.pipe.AAShapePipe.renderTiles(SunGraphics2D, Shape,) line: 204
  sun.java2d.pipe.AAShapePipe.renderPath(SunGraphics2D, Shape,) line: 150
  sun.java2d.pipe.AAShapePipe.fill(SunGraphics2D, Shape) line: 83
  ...
  ]
}
JEP 509: JFR CPU-Time Profiling (Experimental)
JEP 509: JFR CPU-Time Profiling (Experimental) introduces an experimental Linux-only event that uses SIGPROF to record method samples. The current method sampling event, jdk.ExecutionSample, works on all platforms, but it only samples methods running Java code. The new jdk.CPUTimeSample event also takes into account methods executing in native code, for example, a call to a native method using the new FFM API. The feature builds on JEP 518: JFR Cooperative Sampling to ensure that stacks can be walked safely. To try out CPU-time profiling on Linux, use the following commands:
$ java -XX:StartFlightRecording:jdk.CPUTimeSample#enabled=true,filename=c.jfr
$ jfr view cpu-time-hot-methods c.jfr
The JEP is still out for review, but if it is integrated in time for Rampdown Phase One, it will be available in JDK 25.
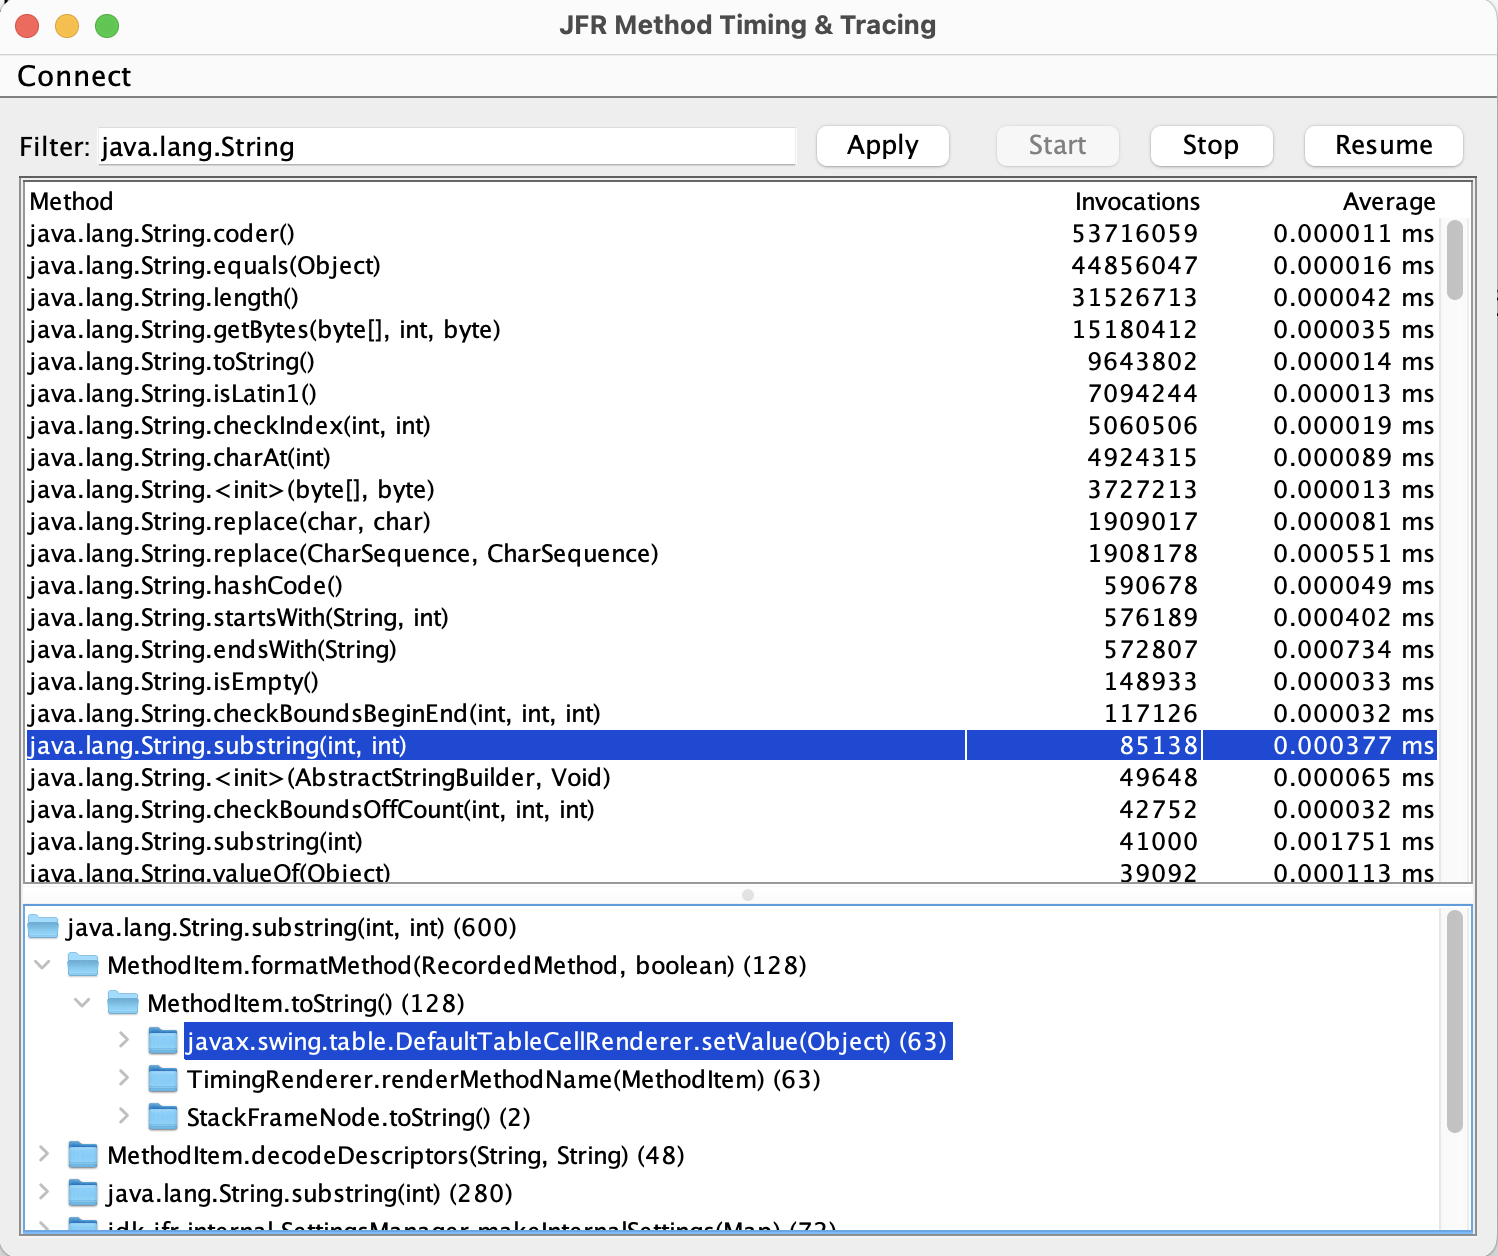
JEP 520: JFR Method Timing & Tracing
JEP 520: JFR Method Timing & Tracing adds two new events to trace and time methods. Timing and tracing method invocations can help identify performance bottlenecks, optimize code, and find the root causes of bugs. The JEP text demonstrates several command-line examples, so they will not be repeated here. Instead, I will display a simple GUI I created to validate the design and to demonstrate how third-party tools can use the JFR APIs with the two new the events.
You can run the program like this. It requires JDK 25 or later:
$ git clone https://github.com/flight-recorder/method-tracer
$ cd method-tracer
$ java MethodTracer.java
The application is Swing-based and can connect to either a local or remote application over JMX. It uses JFR Event Streaming and Remote Recording Streaming for data transfer. If you find issues with the JEP, please report them to the hotspot-jfr-dev mailing list or send a direct message to @ErikGahlin.
Updates to the jfr command
The jfr scrub command is used to remove sensitive information, such as values stored in system properties or environment variables, from a JFR recording file. Previously, verifying the results of the command required using the jfr summary command to compare files before and after scrubbing. In JDK 25, the jfr scrub command has been updated to print the number of events that were removed, making it easier to verify that sensitive information has been redacted. For example:
$ jfr scrub --exclude-events
  jdk.InitialSystemProperty,jdk.InitialEnvironmentVariable r.jfr scrubbed.jfr
Removed events:
jdk.InitialEnvironmentVariable 23/23
jdk.InitialSystemProperty      15/15
Another update to the jfr tool is the new print –exact option. It prints timestamps, timespans, and memory data with full precision. For example:
$ jfr print --exact recording.jfr
jdk.JavaMonitorWait {
  startTime = 20:30:33.091317500 (2025-05-31)
  duration = 0.033899709 s
  monitorClass = sun.java2d.metal.QueueFlusher (classLoader = bootstrap)
  notifier = "AWT-EventQueue-0" (javaThreadId = 32)
  timeout = 0.100000000 s
  timedOut = false
  address = 0x600000334820
  eventThread = "Java2D Queue Flusher" (javaThreadId = 35)
  stackTrace = [
  java.lang.Object.wait0(long)
  java.lang.Object.wait(long) line: 389
  sun.java2d.metal.MTLRenderQueue$QueueFlusher.run() line: 206
  java.lang.Thread.run() line: 1447
  ...
 ]
}
Exact values are useful for comparing results across multiple runs or for including precise information in bug reports. See the CSR for more details.
New report-on-exit Option
The -XX:StartFlightRecording option gets a new sub-option called report-on-exit that prints a report/view when the JVM exits. For more information about views, see my earlier blog post. In the following example, the new method timing event is used to print the time it took for class initializers to execute, which can be useful when optimizing the startup time of your application.
$ java '-XX:StartFlightRecording:method-timing=::<clinit>,
       report-on-exit=method-timing' -jar J2Ddemo.jar

                                        Method Timing

Timed Method                                         Invocations Average Time
-----------------------------------------------------------------------------
java.awt.GraphicsEnvironment$LocalGE.<clinit>()                1 39.200000 ms
sun.font.HBShaper.<clinit>()                                   1 32.400000 ms
java2d.DemoFonts.<clinit>()                                    1 21.400000 ms
java.nio.file.TempFileHelper.<clinit>()                        1 16.200000 ms
java.awt.Component.<clinit>()                                  1 14.300000 ms
sun.font.SunFontManager.<clinit>()                             1 10.900000 ms
sun.java2d.SurfaceData.<clinit>()                              1  9.480000 ms
java.awt.Toolkit.<clinit>()                                    1  8.500000 ms
java.awt.Font.<clinit>()                                       1  8.330000 ms
java.security.Security.<clinit>()                              1  7.570000 ms
 ...
Another example of the report-on-exit option is to print a summary of GC pauses when the application exits:
$ java -XX:StartFlightRecording:report-on-exit=gc-pauses -jar J2Ddemo.jar

GC Pauses
--------

Total Pause Time: 331 ms

Number of Pauses: 101

Minimum Pause Time: 0.00629 ms

Median Pause Time: 0.861 ms

Average Pause Time: 3.28 ms

P90 Pause Time: 13.0 ms

P95 Pause Time: 19.7 ms

P99 Pause Time: 21.7 ms

P99.9% Pause Time: 21.7 ms

Maximum Pause Time: 21.7 ms
For more information about the feature, see the CSR, or use the new -XX:StartFlightRecording:help command, introduced in JDK 24.
Rate-limited Sampling
JDK 25 will add support for Rate-limited sampling of Java events. For example, you may want to track data that is posted to a queue at a very high frequency. Recording every event may result in the recording file becoming filled with queue-related events, potentially displacing other important data. By annotating your event with @Throttle, you can set an upper limit on the number of events per time unit. For example:
@Throttle(“300/s”)
@Label(“Post Message”)
@Name(“example.PostMessage”)
@Category(“Message Queue”)
static class PostMessageEvent extends Event {
  @Label(“Message”)
  String message;
}

void postMessage(Channel channel, String message) {
  channel.publish(message);
  PostMessageEvent e = new PostMessageEvent();
  if (e.shouldCommit()) {
    if (message.length() < 26) {
      e.message = message;
    } else {
      e.message = message.substring(0, 22) + "...";
    }
    e.commit();
  }
}
Event objects that are throttled cannot be reused because they must hold their sample state between a call to shouldCommit() and commit(). Like other event settings, throttling can be controlled from the command line. The following example shows how throttling can be disabled so that all events are emitted:
$ java -XX:StartFlightRecording:example.PostMessage#throttle=off ...
Contextual Events
JDK 25 comes with a new annotation to help tools visualize contextual information. Contextual information here refers to data shared across all events in the same thread during the lifespan of an event annotated with @Contextual.
For example, to trace requests or transactions in a system, a trace event can be created to provide context.
@Label("Trace")
@Name("com.example.Trace")
class TraceEvent extends Event {
  @Label("ID")
  @Contextual
  String id;

  @Label("Name")
  @Contextual
  String name;
}
To track details within an order service, an order event can be created where only the order ID provides context.
@Label("Order")
@Name("com.example.Order")
class OrderEvent extends Event {
  @Label("Order ID")
  @Contextual
  long id;

  @Label("Order Date")
  @Timestamp(Timestamp.MILLISECONDS_SINCE_EPOCH)
  long date;

  @Label("Payment Method")
  String paymentMethod;
}
If an order in the order service stalls due to lock contention, a user interface can display contextual information together with the JavaMonitorEnter event to simplify troubleshooting, for example:
$ jfr print --events JavaMonitorEnter recording.jfr
jdk.JavaMonitorEnter {
  Context: Trace.id = "00-0af7651916cd43dd8448eb211c80319c-00f067aa0ba902b7-01"
  Context: Trace.name = "POST /checkout/place-order"
  Context: Order.id = 314159
  startTime = 17:51:29.038 (2025-02-07)
  duration = 50.56 ms
  monitorClass = java.util.ArrayDeque (classLoader = bootstrap)
  previousOwner = "Order Thread" (javaThreadId = 56209, virtual = true)
  address = 0x60000232ECB0
  eventThread = "Order Thread" (javaThreadId = 52613, virtual = true)
  stackTrace = [
   java.util.zip.ZipFile$CleanableResource.getInflater() line: 685
   java.util.zip.ZipFile$ZipFileInflaterStream.<init>() line: 388
   java.util.zip.ZipFile.getInputStream(ZipEntry) line: 355
   java.util.jar.JarFile.getInputStream(ZipEntry) line: 833
   ...
 ]
}
Removal of the Security Manager
With JDK 24, the Security Manager was permanently disabled, which allowed for the removal of around 3,000 lines of JFR code in JDK 25. You may notice this as faster startup when using JFR, as the number of classes that need to be loaded is reduced. But more importantly, OpenJDK developers no longer need to analyze every new feature to make it work with the Security Manager.
Going forward, expect a more rapid stream of enhancements!