
JDK 17 was released with several improvements to JFR ergonomics.
Configuration wizard
To help make event configuration easier, a new configure command was added to the jfr tool:
$ jfr configure
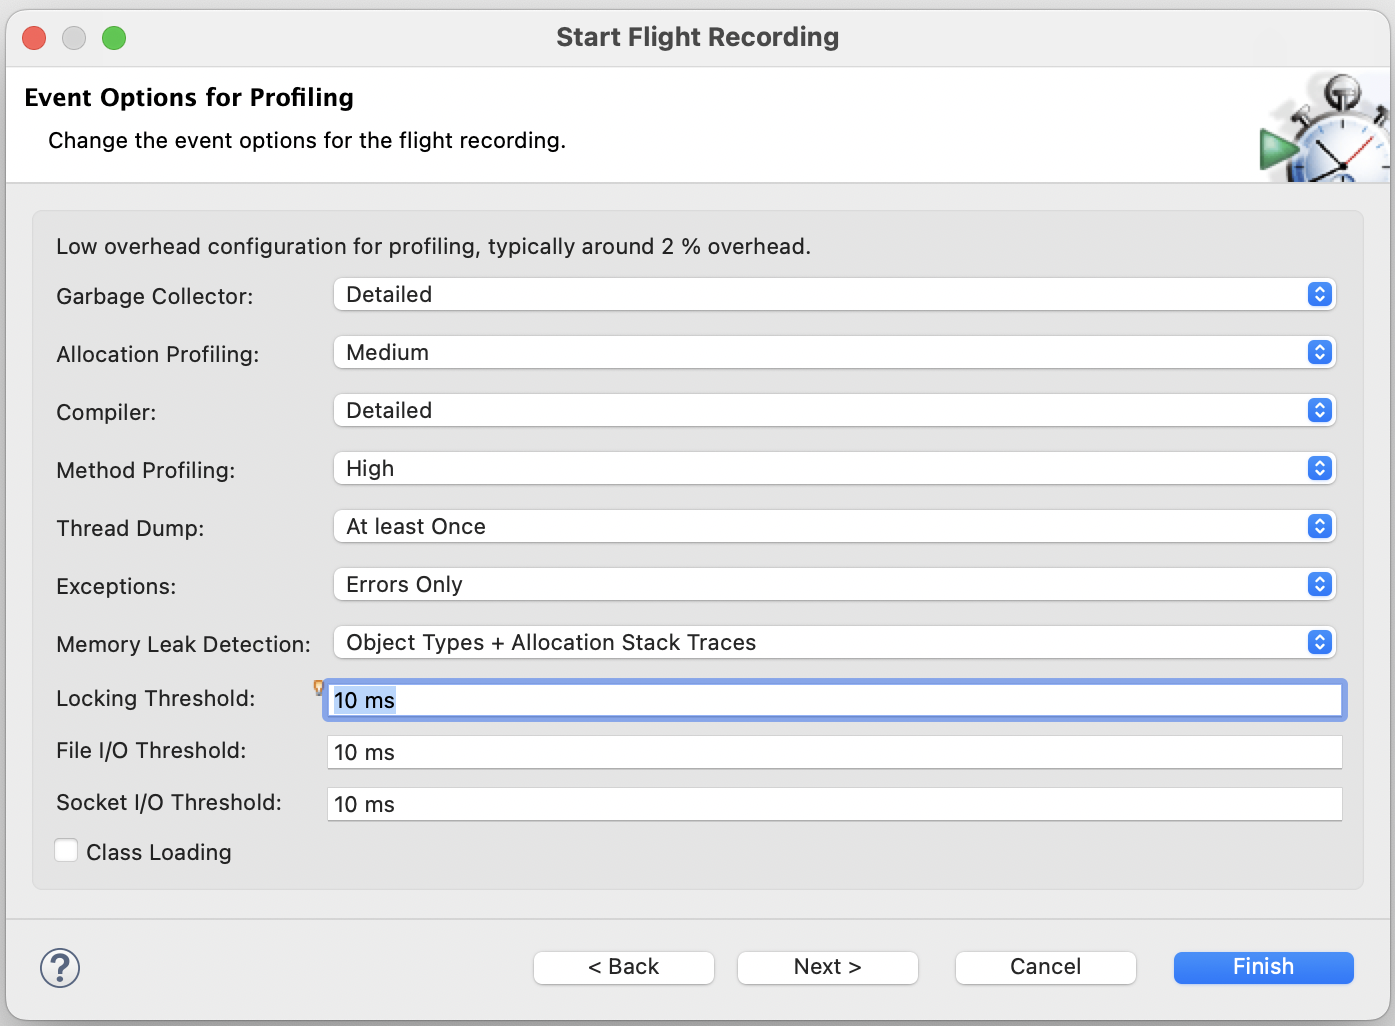
The command provides an interactive mode that can configure events using options previously only available in the JMC Recording Wizard.
To start interactive mode, use the –interactive flag:
$ jfr configure --interactive
============== .jfc Configuration Wizard ============
This wizard will generate a JFR configuration file by
asking 12 questions. Press ENTER to use the default
value, or type Q to abort the wizard.

Garbage Collector: Normal (default)
1. Off
2. Normal
3. Detailed
4. High, incl. TLABs/PLABs (may cause many events)
5. All, incl. Heap Statistics (may cause long GCs)

Using default: Normal

Allocation Profiling: Low (default)
1. Off
2. Low
3. Medium
4. High
5. Maximum

Using default: Low

Compiler: Normal (default)
1. Off
2. Normal
3. Detailed
4. All

...

Socket I/O Threshold: 20 ms  (default)

Using default: 20 ms

Class Loading [Y/N]: No (default)

Using default: No

Filename: custom.jfc (default)

Configuration written successfully to:
/Users/jfr/custom.jfc
By default, the configuration is written to a file called custom.jfc. This file can be passed to -XX:StartFlightRecording or jcmd when starting a recording:
$ java -XX:StartFlightRecording:settings=custom.jfc -jar app.jar

$ jcmd <pid> JFR.start settings=custom.jfc
Options can also be configured without using the interactive wizard, for example:
$ jfr configure method-profiling=high gc=high class-loading=true
Available options depend on the JDK version. Use help configure to see a list:
$ jfr help configure
These are the options available in the default configuration (default.jfc) for JDK 17/18:
  gc=<off|normal|detailed|high|all>

  allocation-profiling=<off|low|medium|high|maximum>

  compiler=<off|normal|detailed|all>

  method-profiling=<off|normal|high|max>

  thread-dump=<off|once|60s|10s|1s>

  exceptions=<off|errors|all>

  memory-leaks=<off|types|stack-traces|gc-roots>

  locking-threshold=<timespan>

  file-threshold=<timespan>

  socket-threshold=<timespan>

  class-loading=<true|false>
To explicitly control the name of the output file, i.e. to use a name other than custom.jfc, specify the filename using the –output option:
$ jfr configure exceptions=all --output exceptions.jfc

$ java -XX:StartFlightRecording:settings=exceptions.jfc
Please remember that if JDK event settings are changed to something other than the default, the overhead could exceed 1%, and the application’s responsiveness may suffer. For example, the memory-leaks=gc-roots option will stop all Java threads and sweep the heap when a recording ends. This could halt the application for seconds. Always try out a custom configuration, to ensure that the overhead is acceptable, before using it in production.
The configure command can also change settings of individual events. This can be useful when creating user-defined events to troubleshoot an application specific issue. Don’t worry too much about overhead when adding events to your application. If the event is disabled, the implementation will be empty. The HotSpot C2 compiler is usually able to eliminate the event if the object doesn’t escape the method.
Here is an example of a user-defined event:
@Name("com.company.HttpGetRequest")
@Label("HTTP GET Request")
@Category("HTTP")
@Enabled(false)
@StackTrace(false)
@Threshold("0 ms")
public class HttpGetRequest extends jdk.jfr.Event {
  @Label("Request URI")
  String uri;
}

protected void doGet(HttpServletRequest req, HttpServletResponse resp) {
 HttpGetRequest request = new HttpGetRequest();
 request.begin();
 request.uri = req.getRequestURI();
 ...
 request.commit();
}
To add the event to a configuration file, specify the event name, followed by “#” and a key-value pair:
$ jfr configure +com.company.HttpGetRequest#enabled=true --output http.jfc
The plus sign here means that the specified setting will be added to the default set of settings.
If “+” is omitted, the tool will assume an existing setting is to be changed. Since com.company.HttpGetRequest is not part of the JDK events, the tool will fail with an error message. This behavior reduces the risk of entering misspelled JDK events into configuration files.
To list all available events for a JDK release, use the metadata command:
$ jfr metadata
The following commands show how settings for a socket and method sampling event can be configured individually:
$ jfr configure jdk.SocketRead#enabled=true jdk.SocketRead#threshold=0ms jdk.SocketRead#stackTrace=true

$ jfr configure jdk.ExecutionSample#enabled=true jdk.ExecutionSample#period=10ms
That said, most of the time it’s easier to use an option:
$ jfr configure socket-threshold=0ms method-profiling=high
The configure command can also merge configuration files:
$ jfr configure --input my.jfc,default.jfc --output combined.jfc
More information about the event settings syntax can be found in the API documentation
Configure events on command line
After reading all this, you may wonder why you can’t specify options and settings directly when using -XX:StartFlightRecording?
You can!
$ java -XX:StartFlightRecording:allocation-profiling=high

$ java -XX:StartFlightRecording:+com.company.HttpGetRequest#enabled=true
It’s also possible to override a user-defined .jfc file:
$ java -XX:StartFlightRecording:settings=http.jfc,com.company.HttpGetRequest#enabled=false
The plus sign is not necessary here as it will change a setting that already exists in http.jfc. To enable a single event, the option settings=none can be used, which will start JFR without a default configuration (default.jfc):
$ java -XX:StartFlightRecording:settings=none,+com.company.HttpGetRequest#enabled=true

$ java -XX:StartFlightRecording:settings=none,+jdk.SocketRead#enabled=true,+jdk.SocketRead#threshold=1ms
An event may be enabled or disabled by default depending on the @Enabled annotation. All JDK events are disabled by default, but if the -XX:StartFlightRecording:settings option is not specified, a default configuration (default.jfc) will be used that will enable events that are safe to use in production (less than 1% overhead).
The HttpGetRequest event above can be extended with a custom event setting, so events are only emitted for certain URIs. See SettingControl and this blog post by Gunnar Morling.
The URI filter can then be specified on command line:
$ java '-XX:StartFlightRecording:+com.company.HttpGetRequest#uriFilter=https://www.example.com/list/.*'
Log events for debugging
JDK 17 also comes with the capability to write events to the JVM log. This is a development feature, not meant for production, due to the high overhead of formatting the output and printing events while holding a lock.
Example output:
[6.227s][trace][jfr,system,event] jdk.ThreadCPULoad {
[6.227s][trace][jfr,system,event]   startTime = 18:19:27.820 (2022-05-30)
[6.227s][trace][jfr,system,event]   user = 0,08%
[6.227s][trace][jfr,system,event]   system = 0,00%
[6.227s][trace][jfr,system,event]   eventThread = "Image Fetcher 0" (javaThreadId = 37)
[6.227s][trace][jfr,system,event] }
[6.227s][trace][jfr,system,event] jdk.JavaMonitorWait {
[6.227s][trace][jfr,system,event]   startTime = 18:19:22.816 (2022-05-30)
[6.227s][trace][jfr,system,event]   duration = 5,01 s
[6.227s][trace][jfr,system,event]   monitorClass = java.util.Vector (classLoader = bootstrap)
[6.227s][trace][jfr,system,event]   notifier = N/A
[6.227s][trace][jfr,system,event]   timeout = 5,00 s
[6.227s][trace][jfr,system,event]   timedOut = true
[6.227s][trace][jfr,system,event]   address = 0x600002146700
[6.227s][trace][jfr,system,event]   eventThread = "Image Fetcher 1" (javaThreadId = 38)
[6.227s][trace][jfr,system,event]   stackTrace = [
[6.227s][trace][jfr,system,event]     java.lang.Object.wait0(long)
[6.227s][trace][jfr,system,event]     java.lang.Object.wait(long) line: 366
[6.227s][trace][jfr,system,event]     sun.awt.image.ImageFetcher.nextImage() line: 154
[6.227s][trace][jfr,system,event]     sun.awt.image.ImageFetcher.fetchloop() line: 207
[6.227s][trace][jfr,system,event]     sun.awt.image.ImageFetcher.run() line: 176
[6.227s][trace][jfr,system,event]   ]
[6.227s][trace][jfr,system,event] }
To log user-defined events, with a full stack trace, start the JVM with -Xlog:jfr+event=trace:
$ java -Xlog:jfr+event=trace -XX:StartFlightRecording
To limit the stack depth to at most five frames, use -Xlog:jfr+event=debug. For JDK events, use -Xlog:jfr+system+event.
To reduce the noise, this feature is best used together with -XX:StartFlightRecording:settings=none and the event to debug:
$ java -XX:StartFlightRecording:settings=none,+com.company.HttpGetRequest#enabled=true
Events are flushed to the log once every second.
Beware that when the JVM is shutting down, it will not wait for events to be logged before exiting. Don’t be surprised if you do not see those last events.