<?xml version="1.0" encoding="utf-8"?><feed xmlns="http://www.w3.org/2005/Atom" ><generator uri="https://jekyllrb.com/" version="3.10.0">Jekyll</generator><link href="https://egahlin.github.io/feed.xml" rel="self" type="application/atom+xml" /><link href="https://egahlin.github.io/" rel="alternate" type="text/html" /><updated>2026-06-01T11:08:50+00:00</updated><id>https://egahlin.github.io/feed.xml</id><title type="html">Erik Gahlin’s Blog</title><subtitle>A blog about JDK Flight Recorder, OpenJDK and Java.</subtitle><entry><title type="html">JDK 26-27: What’s new in JFR</title><link href="https://egahlin.github.io/2026/05/26/whats-new-in-jdk-26-27.html" rel="alternate" type="text/html" title="JDK 26-27: What’s new in JFR" /><published>2026-05-26T14:30:24+00:00</published><updated>2026-05-26T14:30:24+00:00</updated><id>https://egahlin.github.io/2026/05/26/whats-new-in-jdk-26-27</id><content type="html" xml:base="https://egahlin.github.io/2026/05/26/whats-new-in-jdk-26-27.html"><![CDATA[<p><strong>JDK 25</strong> introduced three JFR-related JEPs: <a href="https://openjdk.org/jeps/518">JEP 518: JFR Cooperative Sampling</a>, <a href="https://openjdk.org/jeps/509">JEP 509: JFR CPU-Time Profiling (Experimental)</a>, and <a href="https://openjdk.org/jeps/520">JEP 520: JFR Method Timing &amp; Tracing</a>. In <strong>JDK 26</strong>, the focus shifted to maintenance and bug fixes, some of which were also backported to <strong>JDK 25</strong>. Still, a few enhancements were added in <strong>JDK 26</strong>, and a new JEP was introduced in <strong>JDK 27</strong>.</p>

<h2 id="whats-new-in-jdk-26">What’s new in JDK 26</h2>

<p>The <code class="language-plaintext highlighter-rouge">jdk.ClassDefine</code> event now has a <code class="language-plaintext highlighter-rouge">source</code> field that contains the location from which the class was loaded. This is useful for auditing purposes or for determining from which JAR file a class was loaded.</p>

<div class="language-plaintext highlighter-rouge"><div class="highlight"><pre class="highlight"><code>jdk.ClassDefine {
  startTime = 01:58:57.947 (2026-05-24)
  definedClass = java2d.demos.Transforms.TransformAnim$DemoControls (classLoader = app)
  definingClassLoader = jdk.internal.loader.ClassLoaders$AppClassLoader (id = 2)
  source = "file:/app/J2Ddemo.jar"
  eventThread = "AWT-EventQueue-0" (javaThreadId = 37)
  stackTrace = [
    java.lang.ClassLoader.defineClass1(ClassLoader, String, byte[], int, int, ProtectionDomain, String)
    java.lang.ClassLoader.defineClass(String, byte[], int, int, ProtectionDomain) line: 974
    java.security.SecureClassLoader.defineClass(String, byte[], int, int, CodeSource) line: 145
    jdk.internal.loader.BuiltinClassLoader.defineClass(String, Resource) line: 776
    jdk.internal.loader.BuiltinClassLoader.findClassOnClassPathOrNull(String) line: 691
    ...
  ]
}
</code></pre></div></div>

<p>A new <code class="language-plaintext highlighter-rouge">jdk.FinalFieldMutation</code> event was also added to help locate code paths where final fields are being modified. For more information about how final fields are becoming truly final, see <a href="https://openjdk.org/jeps/500">JEP 500: Prepare to Make Final Mean Final</a>.</p>

<div class="language-plaintext highlighter-rouge"><div class="highlight"><pre class="highlight"><code>jdk.FinalFieldMutation {
  startTime = 14:28:04.730 (2026-05-24)
  declaringClass = FinalFieldMutationEventTest$C (classLoader = app)
  fieldName = "value"
  eventThread = "MainThread" (javaThreadId = 24)
  stackTrace = [
    FinalFieldMutationEventTest.testFieldSet() line: 84
    jdk.internal.reflect.DirectMethodHandleAccessor.invoke(Object, Object[]) line: 104
    java.lang.reflect.Method.invoke(Object, Object[]) line: 583
    org.junit.platform.commons.util.ReflectionUtils.invokeMethod(Method, Object, Object[]) line: 786
    org.junit.platform.commons.support.ReflectionSupport.invokeMethod(Method, Object, Object[]) line: 514
    ...
  ]
}
</code></pre></div></div>

<p>A new <code class="language-plaintext highlighter-rouge">jdk.StringDeduplication</code> event was also added to help tune string deduplication heuristics. The event is emitted during string deduplication processing and exposes aggregate statistics for each deduplication cycle. It provides information similar to what you can get with <code class="language-plaintext highlighter-rouge">-Xlog:stringdedup*=debug</code>.</p>

<p>Here is what the event looks like:</p>

<div class="language-plaintext highlighter-rouge"><div class="highlight"><pre class="highlight"><code>jdk.StringDeduplication {
  startTime = 14:39:05.117 (2026-05-24)
  duration = 0.402 ms
  inspected = 3334
  known = 2099
  shared = 0
  newStrings = 1235
  newSize = 127.4 kB
  replaced = 27
  deleted = 0
  deduplicated = 1602
  deduplicatedSize = 42.4 kB
  skippedDead = 6
  skippedIncomplete = 0
  skippedShared = 0
  processing = 0.389 ms
  tableResize = 0 s
  tableCleanup = 0 s
}
</code></pre></div></div>

<h2 id="what-to-expect-from-jdk-27">What to expect from JDK 27</h2>

<p><strong>JDK 27</strong> introduces a new help option: <code class="language-plaintext highlighter-rouge">-XX:FlightRecorderOptions:help</code>. This option describes all available Flight Recorder options for a particular JDK release and includes example command lines.</p>

<p>There is also a new JEP under development, <a href="https://openjdk.org/jeps/536">JEP 536: JFR In-Process Data Redaction</a>, which can redact sensitive information in three events (<code class="language-plaintext highlighter-rouge">jdk.JVMInformation</code>, <code class="language-plaintext highlighter-rouge">jdk.InitialEnvironmentVariable</code>, and <code class="language-plaintext highlighter-rouge">jdk.InitialSystemProperty</code>) before the data is written to JFR buffers. Since <strong>JDK 21</strong>, a <code class="language-plaintext highlighter-rouge">jfr scrub</code> command has existed to remove these events if they contain passwords, tokens, or other sensitive information:</p>

<div class="language-plaintext highlighter-rouge"><div class="highlight"><pre class="highlight"><code>$ jfr scrub JVMInformation,InitialEnvironmentVariable,jdk.InitialSystemProperty recording.jfr
</code></pre></div></div>

<p>The problem is that many users are unaware of this tool, so we wanted a mechanism that could redact the most common secrets by default. Furthermore, removing an event entirely can also remove information that is vital for troubleshooting an application, such as the GC in use or heap size settings.</p>

<p>Another important aspect is that if you use Event Streaming or connect to the application over JMX, the information may leave the host before ever being written to a file. Redaction therefore happens before the data is written to JFR buffers.</p>

<p>For example, you might start an application with JFR enabled like below:</p>

<div class="language-plaintext highlighter-rouge"><div class="highlight"><pre class="highlight"><code>$ export ACCESS_TOKEN=SECRET_TOKEN

$ java -XX:StartFlightRecording:filename=recording.jfr \
    -Xmx2G \
    -Djavax.net.ssl.keyStorePassword=SECRET_PASSWORD \
    -jar application.jar \
    --dbpassword ANOTHER_SECRET_PASSWORD --verbose
</code></pre></div></div>

<p>If you print the contents of the recording, you will see sensitive information being replaced by <code class="language-plaintext highlighter-rouge">[REDACTED]</code>:</p>

<div class="language-plaintext highlighter-rouge"><div class="highlight"><pre class="highlight"><code>$ jfr print \
    --events JVMInformation,InitialSystemProperty,InitialEnvironmentVariable \
    recording.jfr

jdk.JVMInformation {
  startTime = 17:39:02.196 (2026-02-15)
  jvmVersion = "Java HotSpot(TM) 64-Bit Server VM"
  jvmArguments = "-XX:StartFlightRecording:filename=recording.jfr -Xmx2G
     -Djavax.net.ssl.keyStorePassword=[REDACTED]"
  jvmFlags = "N/A"
  javaArguments = "-jar application.jar [REDACTED] --verbose"
  jvmStartTime = 17:39:02.050 (2026-02-15)
  pid = 43671
}

jdk.InitialSystemProperty {
  startTime = 17:39:02.196 (2026-02-15)
  key = "javax.net.ssl.keyStorePassword"
  value = "[REDACTED]"
}

jdk.InitialSystemProperty {
  startTime = 17:39:02.196 (2026-02-15)
  key = "sun.java.command"
  value = "-jar application.jar [REDACTED] --verbose"
}

jdk.InitialEnvironmentVariable {
  startTime = 17:39:02.244 (2026-02-15)
  key = "ACCESS_TOKEN"
  value = "[REDACTED]"
}

...
</code></pre></div></div>

<p>If you have tokens, passwords, or other sensitive values that are not matched by the default filters, you can add your own filters using:</p>

<div class="language-plaintext highlighter-rouge"><div class="highlight"><pre class="highlight"><code>-XX:FlightRecorderOptions:redact-key=+filter1...
-XX:FlightRecorderOptions:redact-argument=+filter2...
</code></pre></div></div>

<p>You can view the default filters and learn more about the <code class="language-plaintext highlighter-rouge">redact-key</code> and <code class="language-plaintext highlighter-rouge">redact-argument</code> options by using <code class="language-plaintext highlighter-rouge">-XX:FlightRecorderOptions:help</code>.</p>

<p>Also for <strong>JDK 27</strong>, a new field <code class="language-plaintext highlighter-rouge">hostMemoryUsage</code> was added to the <code class="language-plaintext highlighter-rouge">jdk.ContainerMemoryUsage</code> event that describes the amount of physical memory currently allocated in the host system.</p>

<h2 id="value-events">Value events</h2>

<p>In parallel with this work, several JFR issues related to the upcoming <a href="https://openjdk.org/jeps/401">JEP 401: Value Classes and Objects (Preview)</a> were addressed.</p>

<p>We explored adding support for value events, but decided to postpone that work because the resulting behavior did not consistently match what users would intuitively expect from JFR events. We may revisit the idea later if there is sufficient interest after JEP 401 has been integrated.</p>]]></content><author><name>ErikGahlin</name></author><category term="JFR" /><category term="JDK 26" /><category term="JDK 27" /><summary type="html"><![CDATA[JDK 25 introduced three JFR-related JEPs: JEP 518: JFR Cooperative Sampling, JEP 509: JFR CPU-Time Profiling (Experimental), and JEP 520: JFR Method Timing &amp; Tracing. In JDK 26, the focus shifted to maintenance and bug fixes, some of which were also backported to JDK 25. Still, a few enhancements were added in JDK 26, and a new JEP was introduced in JDK 27.]]></summary></entry><entry><title type="html">What’s new for JFR in JDK 25</title><link href="https://egahlin.github.io/2025/05/31/whats-new-in-jdk-25.html" rel="alternate" type="text/html" title="What’s new for JFR in JDK 25" /><published>2025-05-31T21:10:24+00:00</published><updated>2025-05-31T21:10:24+00:00</updated><id>https://egahlin.github.io/2025/05/31/whats-new-in-jdk-25</id><content type="html" xml:base="https://egahlin.github.io/2025/05/31/whats-new-in-jdk-25.html"><![CDATA[<p><strong>JDK 25</strong>, to be released on <a href="https://openjdk.org/projects/jdk/25/">September 16</a>, is set to include three new <a href="https://openjdk.org/jeps/1">Java Enhancement Proposals</a> (JEPs) for JFR and several enhancements to the <a href="https://docs.oracle.com/en/java/javase/24/docs/api/jdk.jfr/module-summary.html">jdk.jfr API</a> and the <a href="https://docs.oracle.com/en/java/javase/24/docs/specs/man/jfr.html">jfr command</a>.</p>

<h2 id="jep-518-jfr-cooperative-sampling">JEP 518: JFR Cooperative Sampling</h2>

<p><a href="https://openjdk.org/jeps/518">JEP 518: JFR Cooperative Sampling</a> reworks the method sampling mechanism in the <a href="https://wiki.openjdk.org/display/HotSpot">HotSpot JVM</a>. Stack walking now happens from a <a href="https://openjdk.org/groups/hotspot/docs/HotSpotGlossary.html#safepoint">safepoint</a>, but without the safepoint bias that <a href="https://docs.oracle.com/en/java/javase/22/docs/specs/jvmti.html">JVM TI</a>-based profilers suffer from. The result is safer stack walking with <a href="https://wiki.openjdk.org/display/zgc/Main">ZGC</a> and a more scalable method sampler that supports concurrent stack walking. The JEP also adds a new event, <strong>SafepointLatency</strong>, which records the time it takes for a thread to reach a safepoint. You can enable it on the command line as follows:</p>

<div class="language-plaintext highlighter-rouge"><div class="highlight"><pre class="highlight"><code>$ java -XX:StartFlightRecording:jdk.SafepointLatency#enabled=true,filename=r.jfr
$ jfr print --events jdk.SafepointLatency r.jfr
jdk.SafepointLatency {
startTime = 23:57:39.856 (2025-05-31)
duration = 0.0283 ms
threadState = "_thread_in_Java"
eventThread = "AWT-EventQueue-0" (javaThreadId = 32)
stackTrace = [
  sun.java2d.marlin.MarlinTileGenerator.getAlphaNoRLE(byte[], int) line: 268
  sun.java2d.marlin.MarlinTileGenerator.getAlpha(byte[], int, int) line: 193
  sun.java2d.pipe.AAShapePipe.renderTiles(SunGraphics2D, Shape,) line: 204
  sun.java2d.pipe.AAShapePipe.renderPath(SunGraphics2D, Shape,) line: 150
  sun.java2d.pipe.AAShapePipe.fill(SunGraphics2D, Shape) line: 83
  ...
  ]
}
</code></pre></div></div>

<h2 id="jep-509-jfr-cpu-time-profiling-experimental">JEP 509: JFR CPU-Time Profiling (Experimental)</h2>

<p><a href="https://openjdk.org/jeps/509">JEP 509: JFR CPU-Time Profiling (Experimental)</a> introduces an experimental Linux-only event that uses <a href="https://www.gnu.org/software/libc/manual/html_node/Alarm-Signals.html">SIGPROF</a> to record method samples. The current method sampling event, <strong>jdk.ExecutionSample</strong>, works on all platforms, but it only samples methods running Java code. The new <strong>jdk.CPUTimeSample</strong> event also takes into account methods executing in native code, for example, a call to a native method using the new <a href="https://openjdk.org/jeps/454">FFM API</a>. The feature builds on <a href="https://openjdk.org/jeps/518">JEP 518: JFR Cooperative Sampling</a> to ensure that stacks can be walked safely. To try out CPU-time profiling on Linux, use the following commands:</p>

<div class="language-plaintext highlighter-rouge"><div class="highlight"><pre class="highlight"><code>$ java -XX:StartFlightRecording:jdk.CPUTimeSample#enabled=true,filename=c.jfr
$ jfr view cpu-time-hot-methods c.jfr
</code></pre></div></div>

<p>The JEP is still out for review, but if it is integrated in time for <a href="https://openjdk.org/jeps/3#rdp-1">Rampdown Phase One</a>, it will be available in <strong>JDK 25</strong>.</p>

<h2 id="jep-520-jfr-method-timing--tracing">JEP 520: JFR Method Timing &amp; Tracing</h2>

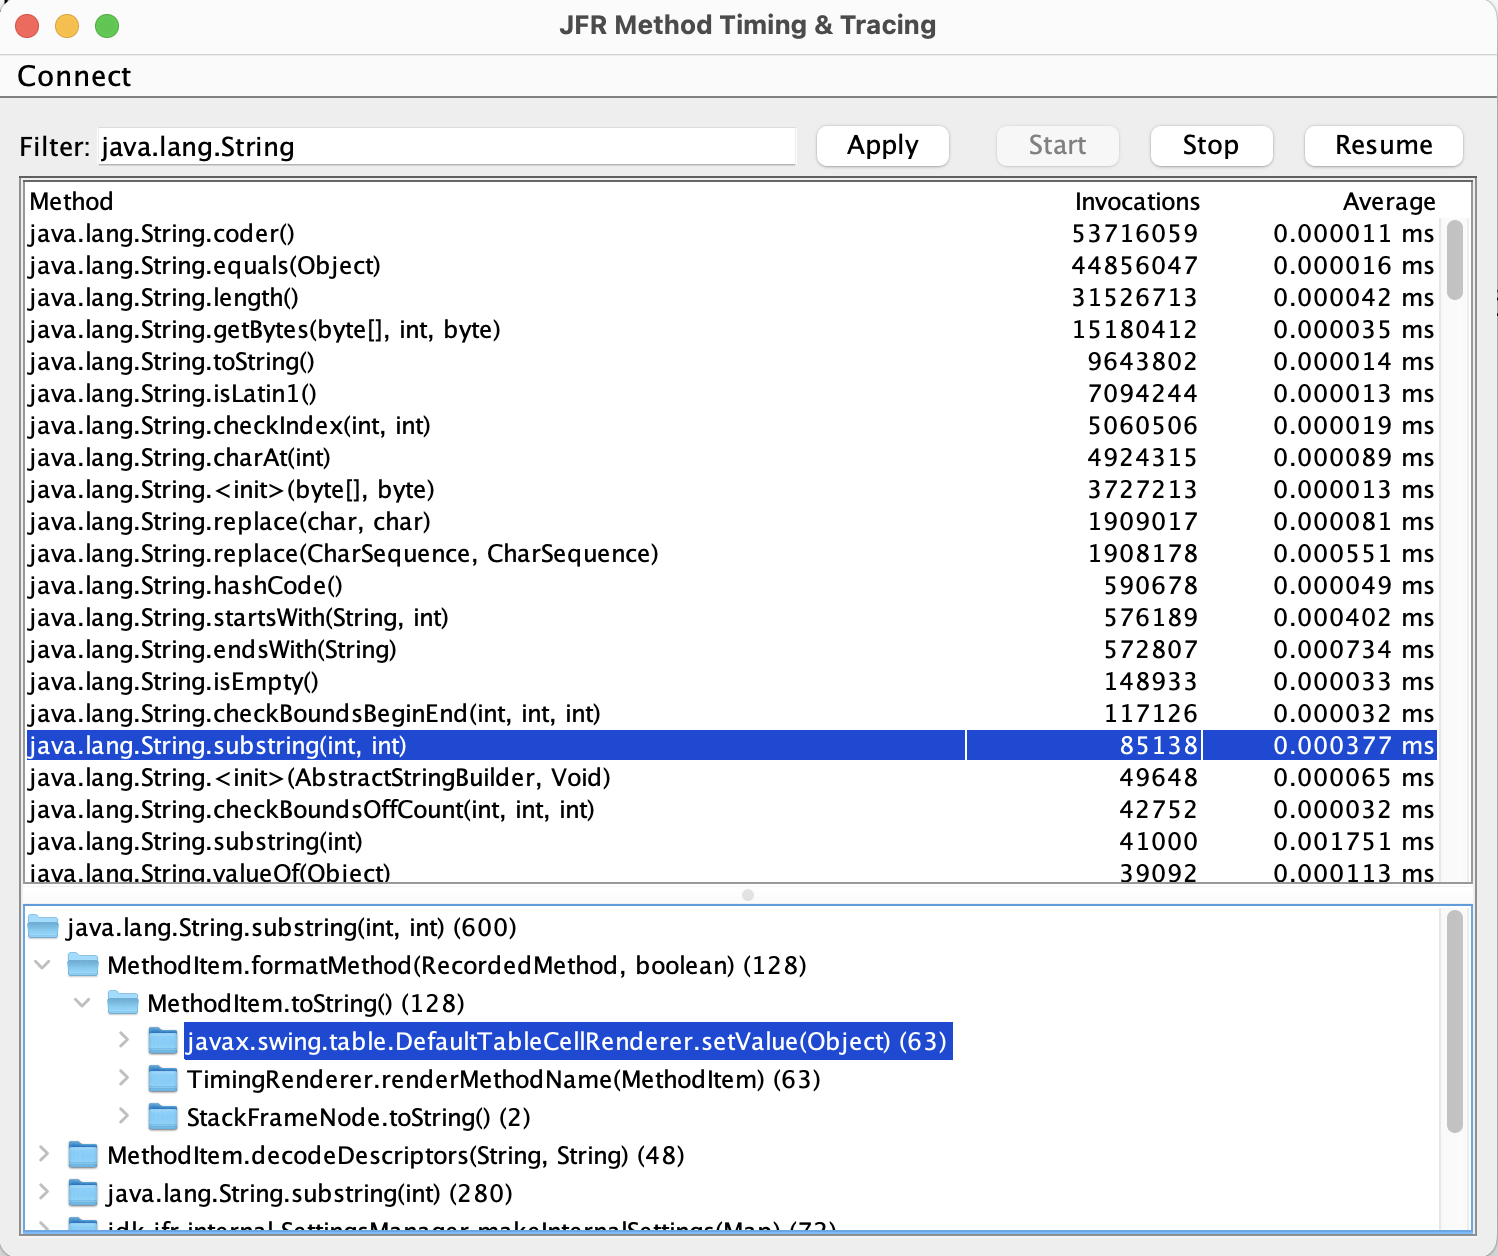
<p><a href="https://openjdk.org/jeps/520">JEP 520: JFR Method Timing &amp; Tracing</a> adds two new events to trace and time methods. Timing and tracing method invocations can help identify performance bottlenecks, optimize code, and find the root causes of bugs. The JEP text demonstrates several command-line examples, so they will not be repeated here. Instead, I will display a simple GUI I created to validate the design and to demonstrate how third-party tools can use the JFR APIs with the two new the events.</p>

<p><img src="/assets/method-tracer-ui.png" alt="Method Tracer GUI" class="center_85" /></p>

<p>You can run the <a href="https://github.com/flight-recorder/method-tracer">program</a> like this. It requires JDK 25 or later:</p>

<div class="language-plaintext highlighter-rouge"><div class="highlight"><pre class="highlight"><code>$ git clone https://github.com/flight-recorder/method-tracer
$ cd method-tracer 
$ java MethodTracer.java
</code></pre></div></div>

<p>The application is <a href="https://docs.oracle.com/javase/tutorial/uiswing/TOC.html">Swing-based</a> and can connect to either a local or remote application over <a href="https://docs.oracle.com/en/java/javase/24/jmx/introduction-jmx-technology.html">JMX</a>. It uses <a href="https://openjdk.org/jeps/349">JFR Event Streaming</a> and <a href="https://egahlin.github.io/2021/05/17/remote-recording-stream.html">Remote Recording Streaming</a> for data transfer. If you find issues with the JEP, please report them to the <a href="https://mail.openjdk.org/mailman/listinfo/hotspot-jfr-dev">hotspot-jfr-dev</a> mailing list or send a direct message to <a href="https://x.com/ErikGahlin">@ErikGahlin</a>.</p>

<h2 id="updates-to-the-jfr-command">Updates to the jfr command</h2>

<p>The <strong>jfr scrub</strong> command is used to remove sensitive information, such as values stored in system properties or environment variables, from a JFR recording file. Previously, verifying the results of the command required using the <strong>jfr summary</strong> command to compare files before and after scrubbing. In <strong>JDK 25</strong>, the <strong>jfr scrub</strong> command has been updated to print the number of events that were removed, making it easier to verify that sensitive information has been redacted. For example:</p>

<div class="language-plaintext highlighter-rouge"><div class="highlight"><pre class="highlight"><code>$ jfr scrub --exclude-events
  jdk.InitialSystemProperty,jdk.InitialEnvironmentVariable r.jfr scrubbed.jfr
Removed events:
jdk.InitialEnvironmentVariable 23/23
jdk.InitialSystemProperty      15/15
</code></pre></div></div>

<p>Another update to the <strong>jfr</strong> tool is the new <strong>print –exact</strong> option. It prints timestamps, timespans, and memory data with full precision. For example:</p>

<div class="language-plaintext highlighter-rouge"><div class="highlight"><pre class="highlight"><code>$ jfr print --exact recording.jfr
jdk.JavaMonitorWait {
  startTime = 20:30:33.091317500 (2025-05-31)
  duration = 0.033899709 s
  monitorClass = sun.java2d.metal.QueueFlusher (classLoader = bootstrap)
  notifier = "AWT-EventQueue-0" (javaThreadId = 32)
  timeout = 0.100000000 s
  timedOut = false
  address = 0x600000334820
  eventThread = "Java2D Queue Flusher" (javaThreadId = 35)
  stackTrace = [
  java.lang.Object.wait0(long)
  java.lang.Object.wait(long) line: 389
  sun.java2d.metal.MTLRenderQueue$QueueFlusher.run() line: 206
  java.lang.Thread.run() line: 1447
  ...
 ]
}
</code></pre></div></div>

<p>Exact values are useful for comparing results across multiple runs or for including precise information in bug reports. See the <a href="https://bugs.openjdk.org/browse/JDK-8354195">CSR</a> for more details.</p>

<h2 id="new-report-on-exit-option">New report-on-exit Option</h2>

<p>The <strong>-XX:StartFlightRecording</strong> option gets a new sub-option called <strong>report-on-exit</strong> that prints a report/view when the JVM exits. For more information about views, see my earlier <a href="https://egahlin.github.io/2023/05/30/views.html">blog post</a>. In the following example, the new method timing event is used to print the time it took for class initializers to execute, which can be useful when optimizing the startup time of your application.</p>

<div class="language-plaintext highlighter-rouge"><div class="highlight"><pre class="highlight"><code>$ java '-XX:StartFlightRecording:method-timing=::&lt;clinit&gt;,
       report-on-exit=method-timing' -jar J2Ddemo.jar
   
                                        Method Timing

Timed Method                                         Invocations Average Time
-----------------------------------------------------------------------------
java.awt.GraphicsEnvironment$LocalGE.&lt;clinit&gt;()                1 39.200000 ms
sun.font.HBShaper.&lt;clinit&gt;()                                   1 32.400000 ms
java2d.DemoFonts.&lt;clinit&gt;()                                    1 21.400000 ms
java.nio.file.TempFileHelper.&lt;clinit&gt;()                        1 16.200000 ms
java.awt.Component.&lt;clinit&gt;()                                  1 14.300000 ms
sun.font.SunFontManager.&lt;clinit&gt;()                             1 10.900000 ms
sun.java2d.SurfaceData.&lt;clinit&gt;()                              1  9.480000 ms
java.awt.Toolkit.&lt;clinit&gt;()                                    1  8.500000 ms
java.awt.Font.&lt;clinit&gt;()                                       1  8.330000 ms
java.security.Security.&lt;clinit&gt;()                              1  7.570000 ms
 ...
</code></pre></div></div>

<p>Another example of the <strong>report-on-exit</strong> option is to print a summary of GC pauses when the application exits:</p>

<div class="language-plaintext highlighter-rouge"><div class="highlight"><pre class="highlight"><code>$ java -XX:StartFlightRecording:report-on-exit=gc-pauses -jar J2Ddemo.jar

GC Pauses
--------

Total Pause Time: 331 ms

Number of Pauses: 101

Minimum Pause Time: 0.00629 ms

Median Pause Time: 0.861 ms

Average Pause Time: 3.28 ms

P90 Pause Time: 13.0 ms

P95 Pause Time: 19.7 ms

P99 Pause Time: 21.7 ms

P99.9% Pause Time: 21.7 ms

Maximum Pause Time: 21.7 ms
</code></pre></div></div>

<p>For more information about the feature, see the <a href="https://bugs.openjdk.org/browse/JDK-8351370">CSR</a>, or use the new <a href="https://bugs.openjdk.org/browse/JDK-8326338">-XX:StartFlightRecording:help</a> command, introduced in <a href="https://openjdk.org/projects/jdk/24/">JDK 24</a>.</p>

<h2 id="rate-limited-sampling">Rate-limited Sampling</h2>

<p><strong>JDK 25</strong> will add support for <a href="https://bugs.openjdk.org/browse/JDK-8351594">Rate-limited sampling of Java events</a>. For example, you may want to track data that is posted to a queue at a very high frequency. Recording every event may result in the recording file becoming filled with queue-related events, potentially displacing other important data. By annotating your event with <strong>@Throttle</strong>, you can set an upper limit on the number of events per time unit. For example:</p>

<div class="language-plaintext highlighter-rouge"><div class="highlight"><pre class="highlight"><code>@Throttle(“300/s”)
@Label(“Post Message”)
@Name(“example.PostMessage”)
@Category(“Message Queue”)
static class PostMessageEvent extends Event {
  @Label(“Message”)
  String message; 
}

void postMessage(Channel channel, String message) {
  channel.publish(message);
  PostMessageEvent e = new PostMessageEvent();
  if (e.shouldCommit()) {
    if (message.length() &lt; 26) {
      e.message = message;
    } else {
      e.message = message.substring(0, 22) + "...";
    }
    e.commit();
  }
}
</code></pre></div></div>

<p>Event objects that are throttled cannot be reused because they must hold their sample state between a call to shouldCommit() and commit(). Like other event settings, throttling can be controlled from the command line. The following example shows how throttling can be disabled so that all events are emitted:</p>

<div class="language-plaintext highlighter-rouge"><div class="highlight"><pre class="highlight"><code> $ java -XX:StartFlightRecording:example.PostMessage#throttle=off ...
</code></pre></div></div>

<h2 id="contextual-events">Contextual Events</h2>

<p><strong>JDK 25</strong> comes with a new annotation to help tools visualize contextual information. Contextual information here refers to data shared across all events in the same thread during the lifespan of an event annotated with <strong>@Contextual</strong>.</p>

<p>For example, to trace requests or transactions in a system, a trace event can be created to provide context.</p>

<div class="language-plaintext highlighter-rouge"><div class="highlight"><pre class="highlight"><code>@Label("Trace")
@Name("com.example.Trace")
class TraceEvent extends Event {
  @Label("ID")
  @Contextual
  String id;

  @Label("Name")
  @Contextual
  String name;
}
</code></pre></div></div>

<p>To track details within an order service, an order event can be created where only the order ID provides context.</p>

<div class="language-plaintext highlighter-rouge"><div class="highlight"><pre class="highlight"><code>@Label("Order")
@Name("com.example.Order")
class OrderEvent extends Event {
  @Label("Order ID")
  @Contextual
  long id;

  @Label("Order Date")
  @Timestamp(Timestamp.MILLISECONDS_SINCE_EPOCH)
  long date;

  @Label("Payment Method")
  String paymentMethod;
}
</code></pre></div></div>

<p>If an order in the order service stalls due to lock contention, a user interface can display contextual information together with the <strong>JavaMonitorEnter</strong> event to simplify troubleshooting, for example:</p>

<div class="language-plaintext highlighter-rouge"><div class="highlight"><pre class="highlight"><code>$ jfr print --events JavaMonitorEnter recording.jfr
jdk.JavaMonitorEnter {
  Context: Trace.id = "00-0af7651916cd43dd8448eb211c80319c-00f067aa0ba902b7-01"
  Context: Trace.name = "POST /checkout/place-order"
  Context: Order.id = 314159
  startTime = 17:51:29.038 (2025-02-07)
  duration = 50.56 ms
  monitorClass = java.util.ArrayDeque (classLoader = bootstrap)
  previousOwner = "Order Thread" (javaThreadId = 56209, virtual = true)
  address = 0x60000232ECB0
  eventThread = "Order Thread" (javaThreadId = 52613, virtual = true)
  stackTrace = [
   java.util.zip.ZipFile$CleanableResource.getInflater() line: 685
   java.util.zip.ZipFile$ZipFileInflaterStream.&lt;init&gt;() line: 388
   java.util.zip.ZipFile.getInputStream(ZipEntry) line: 355
   java.util.jar.JarFile.getInputStream(ZipEntry) line: 833
   ...
 ]
}
</code></pre></div></div>

<h2 id="removal-of-the-security-manager">Removal of the Security Manager</h2>

<p>With <strong>JDK 24</strong>, the Security Manager was <a href="https://openjdk.org/jeps/486">permanently disabled</a>, which allowed for the removal of around 3,000 lines of JFR code in <strong>JDK 25</strong>. You may notice this as faster startup when using JFR, as the number of classes that need to be loaded is reduced. But more importantly, OpenJDK developers no longer need to analyze every new feature to make it work with the Security Manager.</p>

<p>Going forward, expect a more rapid stream of enhancements!</p>]]></content><author><name>ErikGahlin</name></author><category term="JFR" /><category term="JDK 25" /><category term="Event" /><summary type="html"><![CDATA[JDK 25, to be released on September 16, is set to include three new Java Enhancement Proposals (JEPs) for JFR and several enhancements to the jdk.jfr API and the jfr command.]]></summary><media:thumbnail xmlns:media="http://search.yahoo.com/mrss/" url="https://egahlin.github.io/assets/method-tracer-ui.png" /><media:content medium="image" url="https://egahlin.github.io/assets/method-tracer-ui.png" xmlns:media="http://search.yahoo.com/mrss/" /></entry><entry><title type="html">Deprecated Event</title><link href="https://egahlin.github.io/2024/05/31/deprecated-event.html" rel="alternate" type="text/html" title="Deprecated Event" /><published>2024-05-31T19:10:24+00:00</published><updated>2024-05-31T19:10:24+00:00</updated><id>https://egahlin.github.io/2024/05/31/deprecated-event</id><content type="html" xml:base="https://egahlin.github.io/2024/05/31/deprecated-event.html"><![CDATA[<p>In JDK 22, an event was added to JFR to detect invocations of deprecated methods. The main use case is to determine if a third-party library depends on methods that are going to be removed, for example, methods related to the Security Manager. See <a href="https://openjdk.org/jeps/411">JEP 411: Deprecate the Security Manager for Removal</a> for further information.</p>

<p>By detecting the use of a deprecated method early in the development process, there is additional time to upgrade, switch to another library, or file a bug with the maintainer of the library. In the future, <a href="https://jdk.java.net/jmc/9/">JDK Mission Control</a> may be extended with a rule to detect deprecated invocations.</p>

<p>To demonstrate how the event works, two classes will be used, both containing invocations to methods deprecated for removal.</p>

<div class="language-plaintext highlighter-rouge"><div class="highlight"><pre class="highlight"><code>public class API {
  public static void enableLogging(boolean enable) {
    AccessController.doPrivileged(new PrivilegedAction&lt;Void&gt;() {
      public Void run() {
        System.setProperty("log", String.valueOf(enable));
        return null;
      }
    });
  }
  public static void runTask(Runnable task) {
    try {
      task.run();
    } catch (ThreadDeath td) {
      System.out.println("Task stopped.");
    }
  }
}

public class Service {
  public static void log(String message) {
    String shouldLog = System.getProperty("log", "true");
    if (new Boolean("log")) {
      System.out.print(message);
    }
  }
}
</code></pre></div></div>

<p>If the above classes are compiled, three warnings are printed:</p>

<div class="language-plaintext highlighter-rouge"><div class="highlight"><pre class="highlight"><code>$ javac API.java Service.java
API.java:7: warning: [removal] AccessController in java.security has been deprecated and marked for removal
                AccessController.doPrivileged(new PrivilegedAction&lt;Void&gt;() {
                ^
API.java:18: warning: [removal] ThreadDeath in java.lang has been deprecated and marked for removal
                } catch (ThreadDeath td) {
                         ^
Service.java:4: warning: [removal] Boolean(String) in Boolean has been deprecated and marked for removal
                if (new Boolean("log")) {
                    ^
3 warnings
</code></pre></div></div>

<p>These warnings should be fixed, but if the classes are in a library, perhaps compiled and download before the methods were deprecated, they may be missed. Let’s put the classes in a jar file, create an <strong>Application</strong> class that uses them, and run the application with JFR:</p>

<div class="language-plaintext highlighter-rouge"><div class="highlight"><pre class="highlight"><code>$ jar cf library.jar *.class
$ rm *.class *.java

public class Application {
  public static void main(String... args) throws Exception {
    API.enableLogging(true);
    Class.forName("Service").getMethod("log").invoke(null, "Program started.");
  }
}
</code></pre></div></div>

<p>The deprecated event is enabled by default, so no configuration is needed besides starting JFR:</p>

<div class="language-plaintext highlighter-rouge"><div class="highlight"><pre class="highlight"><code>$ java -XX:StartFlightRecording:filename=recording.jfr -cp library.jar Application.java 
</code></pre></div></div>

<p>In the above example, a recording file is written when the application exits. The <strong>jfr view</strong> command can be used to see the invocations:</p>

<div class="language-plaintext highlighter-rouge"><div class="highlight"><pre class="highlight"><code>$ jfr view deprecated-methods-for-removal recording.jfr
    
                         Deprecated Methods for Removal

Deprecated Method                                             Called from Class
------------------------------------------------------------- -----------------
java.lang.Boolean.&lt;init&gt;(String)                              Service          
java.security.AccessController.doPrivileged(PrivilegedAction) API      
</code></pre></div></div>

<p>Notice that the <strong>API::runTask</strong> method is not listed. There are two reasons for that. First, it’s never invoked, and JFR purposely only reports methods that are actually called. Second, the method references a deprecated class, but JFR only tracks calls to deprecated methods.</p>

<p>If you want to know all usages of deprecated APIs in a library, the <strong>jdeprscan</strong> tool is a better alternative:</p>

<div class="language-plaintext highlighter-rouge"><div class="highlight"><pre class="highlight"><code>$ jdeprscan --for-removal library.jar
Jar file library.jar:
class API uses deprecated class java/security/AccessController (forRemoval=true)
class API uses deprecated class java/lang/ThreadDeath (forRemoval=true)
class Service uses deprecated method java/lang/Boolean::&lt;init&gt;(Ljava/lang/String;)V (forRemoval=true)
</code></pre></div></div>

<p>The event emitted by JFR contains both the caller and callee, as we can see if we use the <strong>jfr print</strong> command:</p>

<div class="language-plaintext highlighter-rouge"><div class="highlight"><pre class="highlight"><code>$ jfr print --events jdk.DeprecatedInvocation recording.jfr

jdk.DeprecatedInvocation {
  startTime = 00:31:21.837 (2024-06-02)
  method = java.lang.Boolean.&lt;init&gt;(String)
  invocationTime = 00:31:21.834 (2024-06-02)
  forRemoval = true
  stackTrace = [
    Service.log(String) line: 4
    ...
  ]
}

jdk.DeprecatedInvocation {
  startTime = 00:31:21.837 (2024-06-02)
  method = java.security.AccessController.doPrivileged(PrivilegedAction)
  invocationTime = 00:31:21.834 (2024-06-02)
  forRemoval = true
  stackTrace = [
    API.enableLogging(boolean) line: 7
    ...
  ]
}
</code></pre></div></div>

<p>In the initial design of the event, there was no <strong>stackTrace</strong> field, only the fields <strong>method</strong> and <strong>caller</strong>. By putting the caller as the top frame in the <strong>stackTrace</strong> field, it worked better with existing tools for visualization. It’s not possible to get more than one frame for the event.</p>

<p>The reason the caller class and not the caller method is listed in the <strong>deprecated-methods-for-removal</strong> view is because JFR piggybacks on method resolution inside the JVM. For the interpreter, a check is only made once per caller class. This means only the first call site for a particular class to a specific method generates an event. If the invocation is JIT compiled, all call sites will be reported. This limitation may be lifted in the future.</p>

<p>To record invocations to methods where <strong>@Deprecated(forRemoval=false)</strong> has been set, the event setting <strong>level</strong> can be used. Valid values are <strong>forRemoval</strong> and <strong>all</strong>:</p>

<div class="language-plaintext highlighter-rouge"><div class="highlight"><pre class="highlight"><code>$ java -XX:StartFlightRecording:jdk.DeprecatedInvocation#level=all,filename=recording.jfr -cp library.jar Application.java 
</code></pre></div></div>

<p>I hope this blog post has provided a deeper understanding of how the deprecated event works and its limitations. The greatest benefit of the event will likely be realized in systems that already continuously monitor the JVM. Now, they will be able to detect the use of deprecated methods as well.</p>]]></content><author><name>ErikGahlin</name></author><category term="JFR" /><category term="JDK 22" /><category term="Event" /><summary type="html"><![CDATA[In JDK 22, an event was added to JFR to detect invocations of deprecated methods. The main use case is to determine if a third-party library depends on methods that are going to be removed, for example, methods related to the Security Manager. See JEP 411: Deprecate the Security Manager for Removal for further information.]]></summary></entry><entry><title type="html">View Command</title><link href="https://egahlin.github.io/2023/05/30/views.html" rel="alternate" type="text/html" title="View Command" /><published>2023-05-30T06:10:24+00:00</published><updated>2023-05-30T06:10:24+00:00</updated><id>https://egahlin.github.io/2023/05/30/views</id><content type="html" xml:base="https://egahlin.github.io/2023/05/30/views.html"><![CDATA[<p>JDK 21 comes with a new JFR <strong>view</strong> command that displays aggregated event data in the shell. The command can be used to view information about an application without the need to dump a recording file, or open up 
<a href="https://jdk.java.net/jmc/">JDK Mission Control</a>.</p>

<div class="language-plaintext highlighter-rouge"><div class="highlight"><pre class="highlight"><code>$ jcmd 1739 JFR.view hot-methods

                         Java methods that execute the most

Method                                                        Samples Percent
------------------------------------------------------------- ------- -------
sun.java2d.marlin.Renderer._endRendering(...)                    1659  42.99%
sun.java2d.marlin.MarlinTileGenerator.getAlphaRLE(...)            592  15.34%
sun.java2d.marlin.MarlinCache.copyAARowRLE_WithBlockFlags(...)    447  11.58%
sun.java2d.marlin.MarlinCache.copyAARowNoRLE(...)                 246   6.37%
sun.java2d.marlin.Renderer.addLine(...)                            89   2.31%
sun.java2d.marlin.Renderer.copyAARow(...)                          86   2.23%
sun.java2d.marlin.ArrayCacheInt.fill(...)                          73   1.89%
...
</code></pre></div></div>

<p>To use the command, first start a recording:</p>

<div class="language-plaintext highlighter-rouge"><div class="highlight"><pre class="highlight"><code>$ java -XX:StartFlightRecording -jar my.jar
</code></pre></div></div>

<p>Once the application is running, the <a href="https://docs.oracle.com/en/java/javase/20/docs/specs/man/jcmd.html">jcmd</a> tool can be used to list all running Java processes:</p>

<div class="language-plaintext highlighter-rouge"><div class="highlight"><pre class="highlight"><code>$ jcmd  
37417 my.jar
37418 jdk.jcmd/sun.tools.jcmd.JCmd
</code></pre></div></div>

<p>Use the PID or the name of the jar/class file together with <strong>JFR.view</strong> and the name of the view to display, for example:</p>

<div class="language-plaintext highlighter-rouge"><div class="highlight"><pre class="highlight"><code>$ jcmd 37417 JFR.view allocation-by-site

                                     Allocation by Site

Method                                                  Allocation Pressure
------------------------------------------------------- -------------------
java.lang.StringUTF16.compress(char[], int, int)                     37.50%
java.lang.Integer.valueOf(int)                                       13.75%
spec.jbb.infra.Util.TransactionLogBuffer.getLine(...)                 9.22%
java.math.BigDecimal.valueOf(long, int)                               8.92%
spec.jbb.CustomerReportTransaction.process(...)                       7.55%
java.math.BigDecimal.layoutChars(boolean)                             5.71%
...
</code></pre></div></div>

<p>The <strong>allocation-by-site</strong> view is built from the <strong>jdk.ObjectAllocationSample</strong> event that was added in <strong>JDK 16</strong>. To see a list of all available views, just omit the view name. JDK 21 comes with 70 predefined views, with more to be added in future releases. The views are grouped into three categories: <strong>Java Virtual Machine</strong>, <strong>Environment</strong>, and <strong>Application</strong>.</p>

<div class="language-plaintext highlighter-rouge"><div class="highlight"><pre class="highlight"><code>$ jcmd 37417 JFR.view
...

Java virtual machine views:
 class-modifications       gc-concurrent-phases longest-compilations   
 compiler-configuration    gc-configuration     native-memory-committed
 compiler-phases           gc-cpu-time          native-memory-reserved 
 compiler-statistics       gc-pause-phases      safepoints             
 deoptimizations-by-reason gc-pauses            tlabs                  
 deoptimizations-by-site   gc-references        vm-operations          
 gc                        heap-configuration  

Environment views:
 active-recordings        cpu-information       jvm-flags          
 active-settings          cpu-load              native-libraries   
 container-configuration  cpu-load-samples      network-utilization
 container-cpu-throttling cpu-tsc               recording          
 container-cpu-usage      environment-variables system-information 
 container-io-usage       events-by-count       system-processes   
 container-memory-usage   events-by-name        system-properties  

Application views:
 allocation-by-class   exception-count       native-methods       
 allocation-by-site    file-reads-by-path    object-statistics    
 allocation-by-thread  file-writes-by-path   pinned-threads       
 class-loaders         finalizers            socket-reads-by-host 
 contention-by-address hot-methods           socket-writes-by-host
 contention-by-class   latencies-by-type     thread-allocation    
 longest-class-loading thread-count         
 contention-by-thread  memory-leaks-by-class thread-cpu-load      
 exception-by-message  memory-leaks-by-site  thread-start         
 exception-by-site     modules       
</code></pre></div></div>

<p>By default, a view will cover the last 32 MB of data, although not further back than 10 minutes. To set a custom time range, use the parameters <strong>maxage</strong> and <strong>maxsize</strong>. They work similarly to the <strong>maxage</strong> and <strong>maxsize</strong> parameters for the <strong>JFR.dump</strong> command.</p>

<div class="language-plaintext highlighter-rouge"><div class="highlight"><pre class="highlight"><code>$ jcmd my.jar JFR.view maxage=1h maxsize=2000MB gc-pauses

GC Pauses
---------

Total Pause Time: 2.93 s

Number of Pauses: 272

Minimum Pause Time: 0.471 ms

Median Pause Time: 7.82 ms

Average Pause Time: 10.8 ms

P90 Pause Time: 10.2 ms

P95 Pause Time: 20.9 ms

P99 Pause Time: 256 ms

P99.9% Pause Time: 256 ms

Maximum Pause Time: 256 ms
</code></pre></div></div>

<p>The format of the output can be controlled using the parameters <strong>width</strong>, <strong>cell-height</strong> and <strong>truncate</strong>. The <strong>width</strong> parameter sets the maximum number of characters to use, for example 120. If not set, the table will be sized automatically.</p>

<p>The <strong>cell-height</strong> parameter determines the number of lines to use inside a table cell. For most views, it’s 1 by default, but can be set to a higher value in case the text doesn’t fit. This option is especially useful for displaying multi-line stack traces.</p>

<p>Finally, the <strong>truncate</strong> parameter can be set to <strong>beginning</strong> or <strong>end</strong> to decide if the first or last characters should be omitted in case the text overflows. By default, truncation happens at the end.</p>

<div class="language-plaintext highlighter-rouge"><div class="highlight"><pre class="highlight"><code>$ jcmd my.jar JFR.view cell-height=3 truncate=beginning width=80 system-processes

                                System Processes

First Observed Last Observed PID   Command Line                                
-------------- ------------- ----- --------------------------------------------
13:22:57       13:24:29      13028 C:\Program Files (x86)\Intel\Intel(R) Rapid 
                                   Storage Technology enterprise\IAStorIcon.exe
13:22:57       13:24:29      16200 C:\Program Files\Git\git-bash.exe           
13:22:57       13:24:29      7232  C:\Program Files\Microsoft Visual Studio\202
                                   2\Enterprise\Common7\IDE\PerfWatson2.exe    
13:22:57       13:24:29      18216 C:\Program Files\Microsoft Visual Studio\202
                                   2\Enterprise\Common7\IDE\VC\vcpackages\x86\V
                                   CPkgSrv.exe                                 
13:22:57       13:24:29      8536  C:\Program Files\Microsoft Visual Studio\202
                                   2\Enterprise\Common7\IDE\devenv.exe         
13:22:57       13:24:29      15228 C:\Program Files\Microsoft Visual Studio\202
                                   2\Enterprise\Common7\ServiceHub\Hosts\Servic
                                   eHub.Host.CLR.AnyCPU\ServiceHub.Host.CLR.exe
13:22:57       13:24:29      14128 ...es\Microsoft Visual Studio\2022\Enterpris
                                   e\Common7\ServiceHub\Hosts\ServiceHub.Host.C
                                   LR.AnyCPU\ServiceHub.TestWindowStoreHost.exe
</code></pre></div></div>

<p>The view command can also be used against a recording file by using the <a href="https://docs.oracle.com/en/java/javase/20/docs/specs/man/jfr.html">bin/jfr</a> tool. A file can be created by setting the filename parameter with the <strong>-XX:StartFlightRecording</strong> option. When the JVM exits, the recording contents are written to the file.</p>

<p>Instead of a view, the name of a JFR event can be specified. In the following example, a custom event is created using the <a href="https://docs.oracle.com/en/java/javase/20/docs/api/jdk.jfr/jdk/jfr/Event.html">jdk.jfr</a> event API. In the rendered output, the column headers get their name from the <a href="https://docs.oracle.com/en/java/javase/20/docs/api/jdk.jfr/jdk/jfr/Label.html">Label</a> annotation and the bytes formatting comes from the <a href="https://docs.oracle.com/en/java/javase/20/docs/api/jdk.jfr/jdk/jfr/DataAmount.html">DataAmount</a> annotation.</p>

<div class="language-plaintext highlighter-rouge"><div class="highlight"><pre class="highlight"><code>import jdk.jfr.*;

public class Example {

  @Name("example.FreeMemory")
  @Label("Free Memory")
  static class FreeMemoryEvent extends Event {
    @Description("An approximation of the amount of memory available for allocation")
    @Label("Free Memory")
    @DataAmount(DataAmount.BYTES)
    long free;
  }

  public static void main(String... args) throws Exception {
    for(int i = 0; i &lt; 3; i++) {
      checkFreeMemory();
      Thread.sleep(1000);
    }
  }

  public static void checkFreeMemory() {
    FreeMemoryEvent event = new FreeMemoryEvent();
    event.begin();
    event.free = Runtime.getRuntime().freeMemory();
    event.commit();
  }
}
</code></pre></div></div>

<p>To run the program and display the events:</p>

<div class="language-plaintext highlighter-rouge"><div class="highlight"><pre class="highlight"><code>$ java -XX:StartFlightRecording:filename=recording.jfr Example.java
$ jfr view --cell-height 2 FreeMemory recording.jfr

                                  Free Memory

Start Time  Duration Event Thread     Stack Trace                   Free Memory
---------- --------- ---------------- ----------------------------- -----------
12:25:29   0.0213 ms main             Example.checkFreeMemory()        240.7 MB
                                      Example.main(String[])                   
12:25:30   0.0114 ms main             Example.checkFreeMemory()        238.0 MB
                                      Example.main(String[])                   
12:25:31   0.0218 ms main             Example.checkFreeMemory()        237.7 MB
                                      Example.main(String[])                   
</code></pre></div></div>

<p>To inspect what events are contained in a recording, use the <strong>summary</strong> command:</p>

<div class="language-plaintext highlighter-rouge"><div class="highlight"><pre class="highlight"><code>$ jfr summary recording.jfr
</code></pre></div></div>

<p>The parser that reads the file only parses the events that make up the view, which makes the process quick in most cases. Internally, the views are built using a query language. To see the query that makes up a view, specify the <strong>–verbose</strong> parameter.</p>

<div class="language-plaintext highlighter-rouge"><div class="highlight"><pre class="highlight"><code>$ jfr view --verbose gc recording.jfr

                                  Garbage Collections

Start        GC ID Type                     Heap Before GC Heap After GC  Longest Pause
(startTime) (gcId) (eventType.label)            (heapUsed)    (heapUsed) (longestPause)
----------- ------ ------------------------ -------------- ------------- --------------
13:16:44         0 Young Garbage Collection       409.7 MB        3.1 MB        10.0 ms
13:16:44         1 Old Garbage Collection           3.1 MB        2.6 MB        21.8 ms
13:16:45         2 Young Garbage Collection       330.4 MB        3.9 MB        1.40 ms
13:16:45         3 Old Garbage Collection           3.9 MB        3.5 MB        32.1 ms
13:16:45         4 Young Garbage Collection         3.5 MB        3.5 MB       0.471 ms
13:16:45         5 Old Garbage Collection           3.5 MB        3.5 MB        20.0 ms
13:16:58         6 Young Garbage Collection         2.0 GB       33.0 MB        29.4 ms
...


COLUMN 'Start', 'GC ID', 'Type', 'Heap Before GC', 'Heap After GC', 'Longest Pause'
FORMAT none, none, missing:Unknown, none, none, none SELECT G.startTime, gcId,
[Y|O].eventType.label, B.heapUsed, A.heapUsed, longestPause FROM GarbageCollection AS G,
GCHeapSummary AS B, GCHeapSummary AS A, OldGarbageCollection AS O,
YoungGarbageCollection AS Y WHERE B.when = 'Before GC' AND A.when = 'After GC' GROUP BY
gcId ORDER BY G.startTime
</code></pre></div></div>

<p>In the above example, the view consists of events from four different event types, <strong>jdk.GarbageCollection</strong>, <strong>jdk.GCHeapSummary</strong>, <strong>jdk.YoungGarbageCollection</strong> and <strong>jdk.OldGarbageCollection</strong>. The events are tied together using the <strong>gcId</strong> in the <strong>GROUP BY</strong> clause. The query language, currently experimental, is designed to simplify the process for OpenJDK engineers to define views. In the future, it may be exposed for end-users as well.</p>

<p>To try out the new <strong>view</strong> command, download builds of <a href="https://www.oracle.com/se/java/technologies/downloads/#java21">JDK 21</a></p>

<h3 id="command-line-reference">Command-Line Reference</h3>

<div class="language-plaintext highlighter-rouge"><div class="highlight"><pre class="highlight"><code>jfr view [--verbose]
         [--width &lt;integer&gt;]
         [--truncate &lt;mode&gt;]
         [--cell-height &lt;integer&gt;]
         &lt;view&gt;
         &lt;file&gt;

  --verbose               Displays the query that makes up the view

  --width &lt;integer&gt;       The width of the view in characters. Default value depends on the view

  --truncate &lt;mode&gt;       How to truncate content that exceeds space in a table cell.
                          Mode can be 'beginning' or 'end'. Default value is 'end'

  --cell-height &lt;integer&gt; Maximum number of rows in a table cell. Default value depends on the view

  &lt;view&gt;                  Name of the view or event type to display. See list below for
                          available views

  &lt;file&gt;                  Location of the recording file (.jfr)


jcmd &lt;pid&gt; JFR.view [options]

Options:

cell-height   (Optional) Maximum number of rows in a table cell. (INTEGER, no default value)
   
maxage        (Optional) Length of time for the view to span. (INTEGER followed by  
              's' for seconds 'm' for minutes, or 'h' for hours; default value is 10m)
   
maxsize       (Optional) Maximum size for the view to span in bytes if one of
              the following suffixes is not used: 'm' or 'M' for megabytes OR
              'g' or 'G' for gigabytes. (STRING, default value is 32MB)

truncate      (Optional) How to truncate content that exceeds space in a table cell.
              Mode can be 'beginning' or 'end'. (STRING, default value 'end')

verbose       (Optional) Displays the query that makes up the view.
              (BOOLEAN, default value false)

&lt;view&gt;        (Mandatory) Name of the view or event type to display.
              See list below for available views. (STRING, no default value)

width         (Optional) The width of the view in characters.
              (INTEGER, no default value)
</code></pre></div></div>]]></content><author><name>ErikGahlin</name></author><category term="JFR" /><category term="JDK 21" /><category term="View" /><summary type="html"><![CDATA[JDK 21 comes with a new JFR view command that displays aggregated event data in the shell. The command can be used to view information about an application without the need to dump a recording file, or open up JDK Mission Control.]]></summary><media:thumbnail xmlns:media="http://search.yahoo.com/mrss/" url="https://egahlin.github.io/assets/allocation-by-site.png" /><media:content medium="image" url="https://egahlin.github.io/assets/allocation-by-site.png" xmlns:media="http://search.yahoo.com/mrss/" /></entry><entry><title type="html">Improved Ergonomics</title><link href="https://egahlin.github.io/2022/05/31/improved-ergonomics.html" rel="alternate" type="text/html" title="Improved Ergonomics" /><published>2022-05-31T06:10:24+00:00</published><updated>2022-05-31T06:10:24+00:00</updated><id>https://egahlin.github.io/2022/05/31/improved-ergonomics</id><content type="html" xml:base="https://egahlin.github.io/2022/05/31/improved-ergonomics.html"><![CDATA[<p>JDK 17 was released with several improvements to JFR ergonomics.</p>

<h3 id="configuration-wizard">Configuration wizard</h3>

<p>To help make event configuration easier, a new <strong>configure</strong> command was added to the jfr tool:</p>

<div class="language-plaintext highlighter-rouge"><div class="highlight"><pre class="highlight"><code>$ jfr configure
</code></pre></div></div>

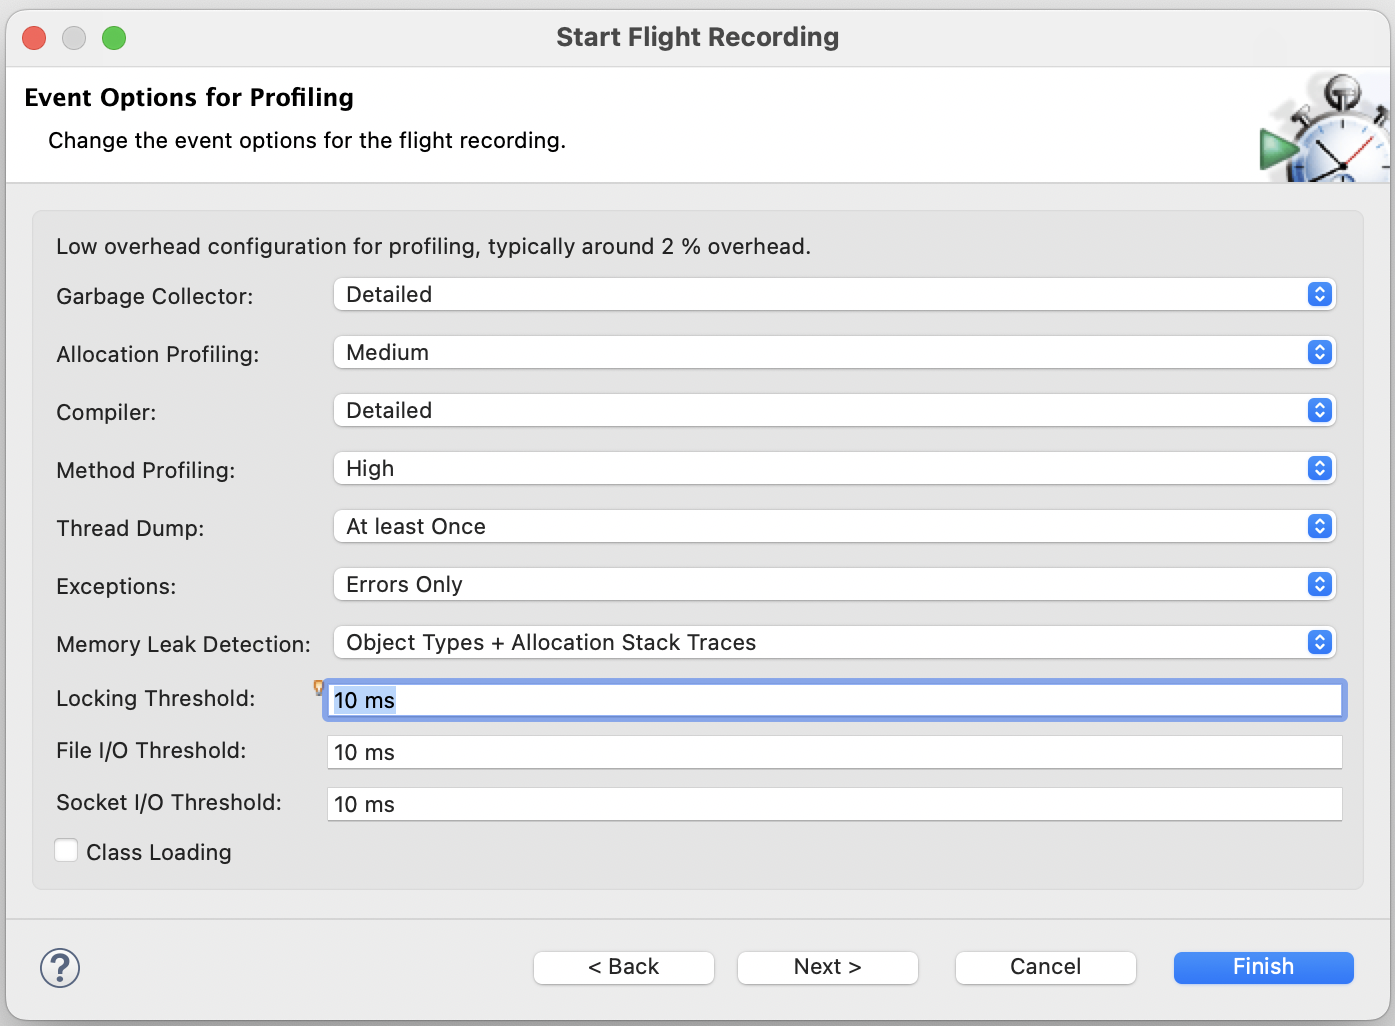
<p>The command provides an interactive mode that can configure events using options previously only available in the <a href="https://www.oracle.com/java/technologies/javase/products-jmc8-downloads.html">JMC</a> Recording Wizard.</p>

<p><img src="/assets/recording-wizard.png" alt="JMC Recording Wizard" class="center_50" /></p>

<p>To start interactive mode, use the <strong>–interactive</strong> flag:</p>

<div class="language-plaintext highlighter-rouge"><div class="highlight"><pre class="highlight"><code>$ jfr configure --interactive
============== .jfc Configuration Wizard ============
This wizard will generate a JFR configuration file by
asking 12 questions. Press ENTER to use the default
value, or type Q to abort the wizard.

Garbage Collector: Normal (default)
1. Off
2. Normal
3. Detailed
4. High, incl. TLABs/PLABs (may cause many events)
5. All, incl. Heap Statistics (may cause long GCs)

Using default: Normal

Allocation Profiling: Low (default)
1. Off
2. Low
3. Medium
4. High
5. Maximum

Using default: Low

Compiler: Normal (default)
1. Off
2. Normal
3. Detailed
4. All

...

Socket I/O Threshold: 20 ms  (default)

Using default: 20 ms

Class Loading [Y/N]: No (default)

Using default: No

Filename: custom.jfc (default)

Configuration written successfully to:
/Users/jfr/custom.jfc
</code></pre></div></div>

<p>By default, the configuration is written to a file called custom.jfc. This file can be passed to <a href="https://docs.oracle.com/en/java/javase/17/docs/specs/man/java.html">-XX:StartFlightRecording</a> or <a href="https://docs.oracle.com/en/java/javase/17/docs/specs/man/jcmd.html">jcmd</a> when starting a recording:</p>

<div class="language-plaintext highlighter-rouge"><div class="highlight"><pre class="highlight"><code>$ java -XX:StartFlightRecording:settings=custom.jfc -jar app.jar

$ jcmd &lt;pid&gt; JFR.start settings=custom.jfc
</code></pre></div></div>

<p>Options can also be configured without using the interactive wizard, for example:</p>

<div class="language-plaintext highlighter-rouge"><div class="highlight"><pre class="highlight"><code>$ jfr configure method-profiling=high gc=high class-loading=true 
</code></pre></div></div>

<p>Available options depend on the JDK version. Use <strong>help configure</strong> to see a list:</p>

<div class="language-plaintext highlighter-rouge"><div class="highlight"><pre class="highlight"><code>$ jfr help configure
</code></pre></div></div>

<p>These are the options available in the default configuration (<strong>default.jfc</strong>) for JDK 17/18:</p>

<div class="language-plaintext highlighter-rouge"><div class="highlight"><pre class="highlight"><code>  gc=&lt;off|normal|detailed|high|all&gt;

  allocation-profiling=&lt;off|low|medium|high|maximum&gt;

  compiler=&lt;off|normal|detailed|all&gt;

  method-profiling=&lt;off|normal|high|max&gt;

  thread-dump=&lt;off|once|60s|10s|1s&gt;

  exceptions=&lt;off|errors|all&gt;

  memory-leaks=&lt;off|types|stack-traces|gc-roots&gt;

  locking-threshold=&lt;timespan&gt;

  file-threshold=&lt;timespan&gt;

  socket-threshold=&lt;timespan&gt;

  class-loading=&lt;true|false&gt;
</code></pre></div></div>

<p>To explicitly control the name of the output file, i.e. to use a name other than <strong>custom.jfc</strong>, specify the filename using the <strong>–output</strong> option:</p>

<div class="language-plaintext highlighter-rouge"><div class="highlight"><pre class="highlight"><code>$ jfr configure exceptions=all --output exceptions.jfc

$ java -XX:StartFlightRecording:settings=exceptions.jfc
</code></pre></div></div>

<p>Please remember that if JDK event settings are changed to something other than the default, the overhead could exceed 1%, and the application’s responsiveness may suffer. For example, the <strong>memory-leaks=gc-roots</strong> option will stop all Java threads and sweep the heap when a recording ends. This could halt the application for seconds. Always try out a custom configuration, to ensure that the overhead is acceptable, before using it in production.</p>

<p>The <strong>configure</strong> command can also change settings of individual events. This can be useful when creating user-defined events to troubleshoot an application specific issue. Don’t worry too much about overhead when adding events to your application. If the event is disabled, the implementation will be <a href="https://github.com/openjdk/jdk/blob/master/src/jdk.jfr/share/classes/jdk/jfr/Event.java">empty</a>. The HotSpot <a href="https://openjdk.java.net/groups/hotspot/docs/HotSpotGlossary.html">C2 compiler</a> is usually able to <a href="https://youtu.be/xrdLLx6YoDM?t=1456">eliminate the event</a> if the object doesn’t escape the method.</p>

<p>Here is an example of a user-defined event:</p>

<div class="language-plaintext highlighter-rouge"><div class="highlight"><pre class="highlight"><code>@Name("com.company.HttpGetRequest")
@Label("HTTP GET Request")
@Category("HTTP")
@Enabled(false)
@StackTrace(false)
@Threshold("0 ms")
public class HttpGetRequest extends jdk.jfr.Event {
  @Label("Request URI")
  String uri;
}

protected void doGet(HttpServletRequest req, HttpServletResponse resp) {
 HttpGetRequest request = new HttpGetRequest();
 request.begin();
 request.uri = req.getRequestURI();
 ...
 request.commit();
}
</code></pre></div></div>

<p>To add the event to a configuration file, specify the event name, followed by “#” and a key-value pair:</p>

<div class="language-plaintext highlighter-rouge"><div class="highlight"><pre class="highlight"><code>$ jfr configure +com.company.HttpGetRequest#enabled=true --output http.jfc
</code></pre></div></div>

<p>The plus sign here means that the specified setting will be added to the default set of settings.</p>

<p>If “+” is omitted, the tool will assume an existing setting is to be changed. Since <strong>com.company.HttpGetRequest</strong> is not part of the JDK events, the tool will fail with an error message. This behavior reduces the risk of entering misspelled JDK events into configuration files.</p>

<p>To list all available events for a JDK release, use the <strong>metadata</strong> command:</p>

<div class="language-plaintext highlighter-rouge"><div class="highlight"><pre class="highlight"><code>$ jfr metadata
</code></pre></div></div>

<p>The following commands show how settings for a socket and method sampling event can be configured individually:</p>

<div class="language-plaintext highlighter-rouge"><div class="highlight"><pre class="highlight"><code>$ jfr configure jdk.SocketRead#enabled=true jdk.SocketRead#threshold=0ms jdk.SocketRead#stackTrace=true

$ jfr configure jdk.ExecutionSample#enabled=true jdk.ExecutionSample#period=10ms 
</code></pre></div></div>

<p>That said, most of the time it’s easier to use an option:</p>

<div class="language-plaintext highlighter-rouge"><div class="highlight"><pre class="highlight"><code>$ jfr configure socket-threshold=0ms method-profiling=high
</code></pre></div></div>

<p>The <strong>configure</strong> command can also merge configuration files:</p>

<div class="language-plaintext highlighter-rouge"><div class="highlight"><pre class="highlight"><code>$ jfr configure --input my.jfc,default.jfc --output combined.jfc
</code></pre></div></div>

<p>More information about the event settings syntax can be found in the API <a href="https://docs.oracle.com/en/java/javase/17/docs/api/jdk.jfr/jdk/jfr/package-summary.html">documentation</a></p>

<h3 id="configure-events-on-command-line">Configure events on command line</h3>

<p>After reading all this, you may wonder why you can’t specify options and settings directly when using <strong>-XX:StartFlightRecording</strong>?</p>

<p><strong>You can!</strong></p>

<div class="language-plaintext highlighter-rouge"><div class="highlight"><pre class="highlight"><code>$ java -XX:StartFlightRecording:allocation-profiling=high

$ java -XX:StartFlightRecording:+com.company.HttpGetRequest#enabled=true
</code></pre></div></div>

<p>It’s also possible to override a user-defined <strong>.jfc</strong> file:</p>

<div class="language-plaintext highlighter-rouge"><div class="highlight"><pre class="highlight"><code>$ java -XX:StartFlightRecording:settings=http.jfc,com.company.HttpGetRequest#enabled=false
</code></pre></div></div>

<p>The plus sign is not necessary here as it will change a setting that already exists in <strong>http.jfc</strong>. To enable a single event, the option <em>settings=none</em> can be used, which will start JFR without a default configuration (<strong>default.jfc</strong>):</p>

<div class="language-plaintext highlighter-rouge"><div class="highlight"><pre class="highlight"><code>$ java -XX:StartFlightRecording:settings=none,+com.company.HttpGetRequest#enabled=true

$ java -XX:StartFlightRecording:settings=none,+jdk.SocketRead#enabled=true,+jdk.SocketRead#threshold=1ms
</code></pre></div></div>

<p>An event may be enabled or disabled by default depending on the <strong>@Enabled</strong> annotation. All JDK events are disabled by default, but if the <strong>-XX:StartFlightRecording:settings</strong> option is not specified, a default configuration (<strong>default.jfc</strong>) will be used that will enable events that are safe to use in production (less than 1% overhead).</p>

<p>The <strong>HttpGetRequest</strong> event above can be extended with a custom event setting, so events are only emitted for certain URIs. See <a href="https://docs.oracle.com/en/java/javase/17/docs/api/jdk.jfr/jdk/jfr/SettingControl.html">SettingControl</a> and this <a href="https://www.morling.dev/blog/rest-api-monitoring-with-custom-jdk-flight-recorder-events/">blog post by Gunnar Morling</a>.</p>

<p>The URI filter can then be specified on command line:</p>

<div class="language-plaintext highlighter-rouge"><div class="highlight"><pre class="highlight"><code>$ java '-XX:StartFlightRecording:+com.company.HttpGetRequest#uriFilter=https://www.example.com/list/.*' 
</code></pre></div></div>

<h3 id="log-events-for-debugging">Log events for debugging</h3>

<p>JDK 17 also comes with the capability to write events to the JVM <a href="https://openjdk.java.net/jeps/158">log</a>. This is a development feature, not meant for production, due to the high overhead of formatting the output and printing events while holding a lock.</p>

<p>Example output:</p>

<div class="language-plaintext highlighter-rouge"><div class="highlight"><pre class="highlight"><code>[6.227s][trace][jfr,system,event] jdk.ThreadCPULoad {
[6.227s][trace][jfr,system,event]   startTime = 18:19:27.820 (2022-05-30)
[6.227s][trace][jfr,system,event]   user = 0,08%
[6.227s][trace][jfr,system,event]   system = 0,00%
[6.227s][trace][jfr,system,event]   eventThread = "Image Fetcher 0" (javaThreadId = 37)
[6.227s][trace][jfr,system,event] }
[6.227s][trace][jfr,system,event] jdk.JavaMonitorWait {
[6.227s][trace][jfr,system,event]   startTime = 18:19:22.816 (2022-05-30)
[6.227s][trace][jfr,system,event]   duration = 5,01 s
[6.227s][trace][jfr,system,event]   monitorClass = java.util.Vector (classLoader = bootstrap)
[6.227s][trace][jfr,system,event]   notifier = N/A
[6.227s][trace][jfr,system,event]   timeout = 5,00 s
[6.227s][trace][jfr,system,event]   timedOut = true
[6.227s][trace][jfr,system,event]   address = 0x600002146700
[6.227s][trace][jfr,system,event]   eventThread = "Image Fetcher 1" (javaThreadId = 38)
[6.227s][trace][jfr,system,event]   stackTrace = [
[6.227s][trace][jfr,system,event]     java.lang.Object.wait0(long)
[6.227s][trace][jfr,system,event]     java.lang.Object.wait(long) line: 366
[6.227s][trace][jfr,system,event]     sun.awt.image.ImageFetcher.nextImage() line: 154
[6.227s][trace][jfr,system,event]     sun.awt.image.ImageFetcher.fetchloop() line: 207
[6.227s][trace][jfr,system,event]     sun.awt.image.ImageFetcher.run() line: 176
[6.227s][trace][jfr,system,event]   ]
[6.227s][trace][jfr,system,event] }
</code></pre></div></div>

<p>To log user-defined events, with a full stack trace, start the JVM with <strong>-Xlog:jfr+event=trace</strong>:</p>

<div class="language-plaintext highlighter-rouge"><div class="highlight"><pre class="highlight"><code>$ java -Xlog:jfr+event=trace -XX:StartFlightRecording
</code></pre></div></div>

<p>To limit the stack depth to at most five frames, use <strong>-Xlog:jfr+event=debug</strong>. For JDK events, use <strong>-Xlog:jfr+system+event</strong>.</p>

<p>To reduce the noise, this feature is best used together with <strong>-XX:StartFlightRecording:settings=none</strong> and the event to debug:</p>

<div class="language-plaintext highlighter-rouge"><div class="highlight"><pre class="highlight"><code>$ java -XX:StartFlightRecording:settings=none,+com.company.HttpGetRequest#enabled=true
</code></pre></div></div>

<p>Events are flushed to the log once every second.</p>

<p>Beware that when the JVM is shutting down, it will not wait for events to be logged before exiting. Don’t be surprised if you do not see those last events.</p>

<h1 id="posts-label"> </h1>

<h2 id="resources">Resources</h2>

<p><a href="https://docs.oracle.com/en/java/javase/17/docs/specs/man/jfr.html">jfr tool</a></p>]]></content><author><name>ErikGahlin</name></author><category term="JFR" /><category term="JDK 17" /><category term="Ergonomics" /><summary type="html"><![CDATA[JDK 17 was released with several improvements to JFR ergonomics.]]></summary><media:thumbnail xmlns:media="http://search.yahoo.com/mrss/" url="https://egahlin.github.io/assets/jfr-configuration-wizard.png" /><media:content medium="image" url="https://egahlin.github.io/assets/jfr-configuration-wizard.png" xmlns:media="http://search.yahoo.com/mrss/" /></entry><entry><title type="html">Remote Recording Stream</title><link href="https://egahlin.github.io/2021/05/17/remote-recording-stream.html" rel="alternate" type="text/html" title="Remote Recording Stream" /><published>2021-05-17T06:10:24+00:00</published><updated>2021-05-17T06:10:24+00:00</updated><id>https://egahlin.github.io/2021/05/17/remote-recording-stream</id><content type="html" xml:base="https://egahlin.github.io/2021/05/17/remote-recording-stream.html"><![CDATA[<p>Application monitoring tools have for a long time been able to fetch data continuously over the network using JMX. For example, the CPU load can be obtained from the OperatingSystemMXBean and visualized in JDK Mission Control. JFR provides richer data that is structured, for example stack traces and timestamped values, but until <a href="https://jdk.java.net/16/">JDK 16</a> there hasn’t been a way to transfer this information over the network as it occurs.</p>

<p>In JDK 14, <a href="https://openjdk.java.net/jeps/349">API support </a> was added to stream events, illustrated by the following code snippets:</p>

<h4 id="1-passive-in-process">1. Passive, in process:</h4>

<div class="language-plaintext highlighter-rouge"><div class="highlight"><pre class="highlight"><code>try (EventStream stream = EventStream.openRepository()) {
    stream.onEvent("jdk.JavaMonitorEnter", System.out::println),
    stream.start();
}
</code></pre></div></div>

<h4 id="2-passive-out-of-process">2. Passive, out of process:</h4>

<div class="language-plaintext highlighter-rouge"><div class="highlight"><pre class="highlight"><code>Path path = Path.of("/repository/2021_05_16_09_48_31_60185");
try (EventStream stream = EventStream.openRepository(path) {
    stream.onEvent("jdk.JavaMonitorEnter", System.out::println),
    stream.start();
}
</code></pre></div></div>

<h4 id="3-active-in-process">3. Active, in process:</h4>

<div class="language-plaintext highlighter-rouge"><div class="highlight"><pre class="highlight"><code>try (RecordingStream stream = new RecordingStream()) {
    stream.enable("jdk.JavaMonitorEnter").withStackTrace();
    stream.onEvent("jdk.JavaMonitorEnter", System.out::println),
    stream.start();
}
</code></pre></div></div>

<p>Active here means that the recording lifecycle and event configuration can be controlled by the stream, as seen in the third code snippet with the enabled method. The above APIs work for many scenarios, but not when there is a need to:</p>

<ul>
  <li>monitor a Java process on a remote host.</li>
  <li>control what is being recorded, on a remote host and/or for another process.</li>
</ul>

<p>Since JDK 11, there exists a <a href="https://docs.oracle.com/en/java/javase/16/docs/api/jdk.management.jfr/jdk/management/jfr/FlightRecorderMXBean.html">FlightRecordingMXBean</a> in OpenJDK that can control and download recordings remotely. This is how <a href="https://www.oracle.com/java/technologies/jdk-mission-control.html">JDK Mission Control</a> fetches recording data and configure events on a remote machine. In JDK 15, and earlier releases, a recording must be stopped before data can be read by a client.</p>

<p>In JDK 16, this restriction was lifted and JFR can now be used to monitor a remote host using a <a href="https://docs.oracle.com/en/java/javase/16/docs/api/java.management/javax/management/MBeanServerConnection.html">MBeanServerConnection</a>.</p>

<h4 id="4-active-out-of-process-and-over-the-network">4. Active, out of process (and over the network)</h4>

<div class="language-plaintext highlighter-rouge"><div class="highlight"><pre class="highlight"><code>String host = "com.example";
int port = 7091;
 
String url = "service:jmx:rmi:///jndi/rmi://" + host + ":" + port + "/jmxrmi";
 
JMXServiceURL u = new JMXServiceURL(url);
JMXConnector c = JMXConnectorFactory.connect(u);
MBeanServerConnection connection = c.getMBeanServerConnection();

try (RemoteRecordingStream stream = new RemoteRecordingStream(connection)) {
    stream.enabled("jdk.JavaMonitorEnter").withStackTrace();
    stream.onEvent("jdk.JavaMonitorEnter", System.out::println),
    stream.start();
}
</code></pre></div></div>

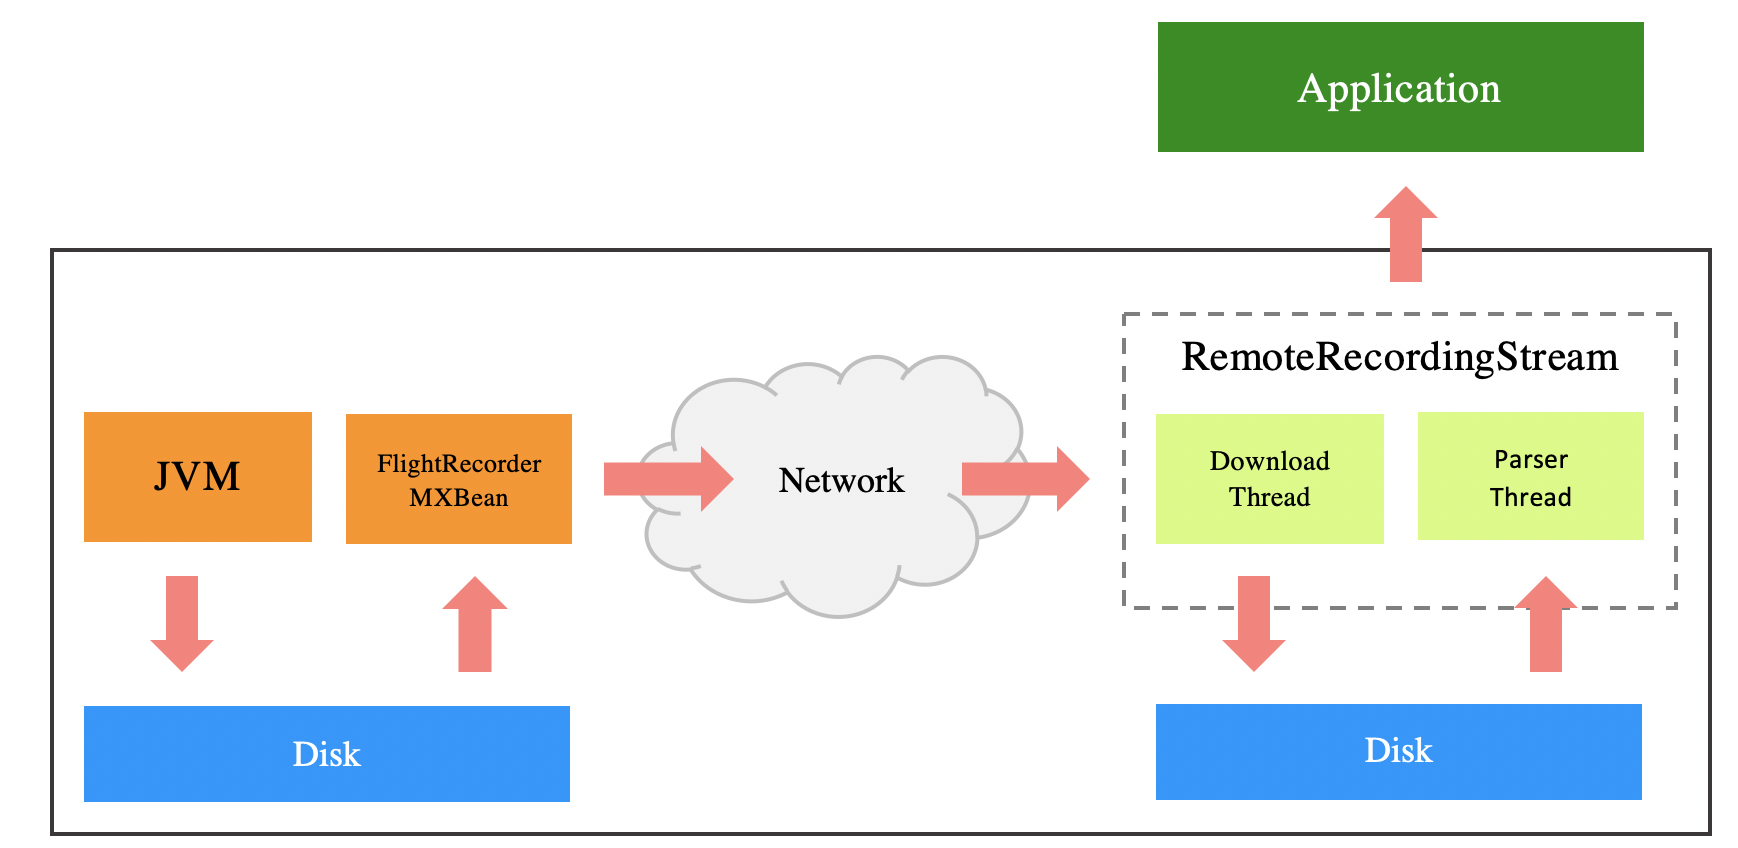
<p>The implementation of RemoteRecordingStream reads bytes of data from the <a href="https://docs.oracle.com/en/java/javase/16/docs/api/jdk.management.jfr/jdk/management/jfr/FlightRecorderMXBean.html#readStream(long)">FlightRecorderMXBean::readStream(long)</a> method and writes it to disk locally, in chunks, similar to what the JVM does on the remote host. Another thread then parses the data on disk and dispatches events to the onEvent handlers. Once every second, new data becomes available to read.</p>

<p>To make sure the parser thread doesn’t read data before a data segment is complete, there is a size field in the chunk header that says how far into the file data can be read. Once new data arrive and a segment becomes complete, the field is updated. To make sure the size field is not modified, while being read, there is a protocol the parser must follow to avoid word tearing.</p>

<p><img src="/assets/remote-streaming-architecture.png" alt="Remote Streaming Overview" class="center_85" /></p>

<p>Once a chunk file has been read and its events dispatched, the file is removed from the client. To instead keep the data, two policies can be set, setMaxAge(Duration) and setMaxSize(long), to determine how long data should be retained.</p>

<p>The RemoteRecordingStream class is not just for streaming events, but also for migrating the disk repository to another host. If the monitored application crashes, and the disk repository files on the host are removed, they are still available on the machine where RemoteRecordingStream operates. Plan is to add a dump method to RemoteRecordingStream, so a file can easily be extracted if something goes wrong.</p>

<h2 id="streaming-event-metadata">Streaming event metadata</h2>

<p>A complication with streaming events from another process is the lack of access to event metadata. When streaming in process, the <a href="https://docs.oracle.com/en/java/javase/16/docs/api/jdk.jfr/jdk/jfr/FlightRecorder.html#getEventTypes()">FlightRecorder::getEventTypes()</a> method can be invoked to get a list of all registered event types.</p>

<p>Without knowledge of the event types, it’s not possible to determine the field layout, or which events that can be enabled/configured.</p>

<p>To remedy the situation, a new method was added to the <a href="https://docs.oracle.com/en/java/javase/16/docs/api/jdk.jfr/jdk/jfr/consumer/EventStream.html">EventStream</a> interface:</p>

<div class="language-plaintext highlighter-rouge"><div class="highlight"><pre class="highlight"><code>void onMetadata(MetadataEvent);
</code></pre></div></div>

<p>The <a href="https://docs.oracle.com/en/java/javase/16/docs/api/jdk.jfr/jdk/jfr/consumer/MetadataEvent.html">MetadataEvent</a> carries a list of all registered event types and the two configurations, “default” and “profile”, that comes with the JDK. The MetadataEvent is sent before any onEvent handler is invoked. If a new event type is registered/unregistered, an updated MetadataEvent is sent.</p>

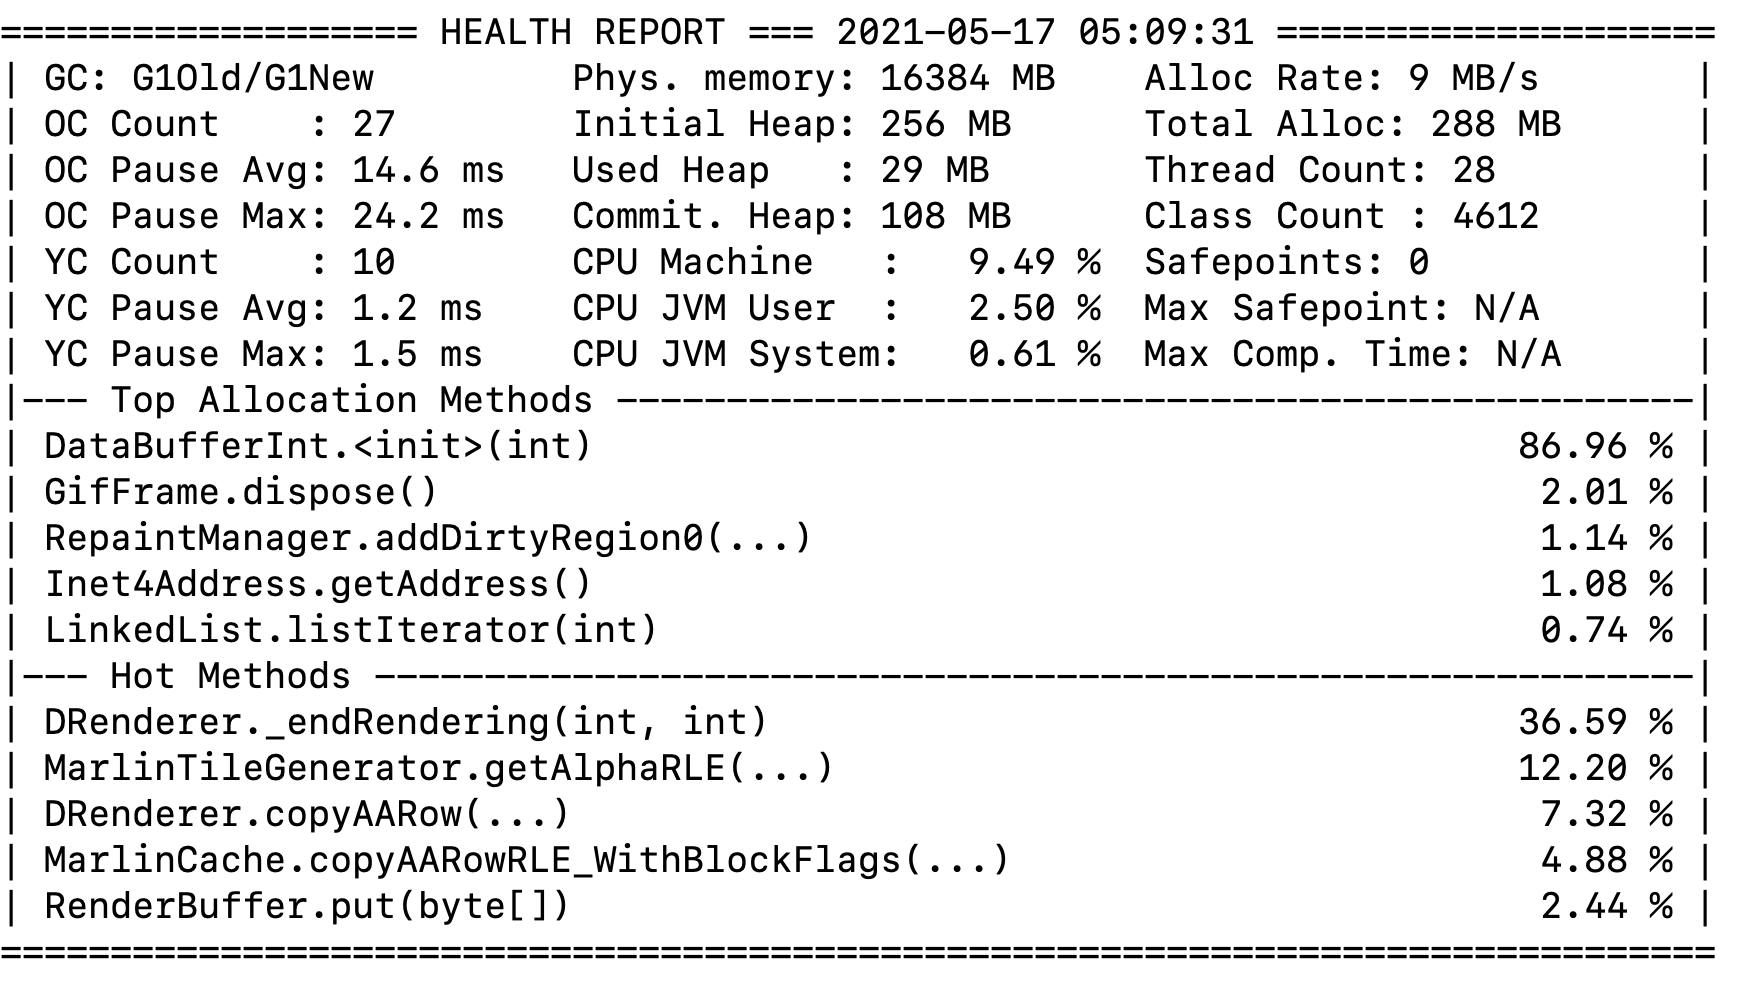
<p>To see the <a href="https://docs.oracle.com/en/java/javase/16/docs/api/jdk.management.jfr/jdk/management/jfr/RemoteRecordingStream.html">RemoteRecordingStream</a> class in action, there exist a small single-file program called <a href="https://github.com/flight-recorder/health-report">Health Report.java</a> that subscribes to events and prints them to standard out.</p>

<p><img src="/assets/HealthReport.png" alt="Health Report" class="center_85" /></p>

<p>Usage:</p>

<div class="language-plaintext highlighter-rouge"><div class="highlight"><pre class="highlight"><code>$ java HealthReport.java com.example:7091
</code></pre></div></div>

<h1 id="posts-label"> </h1>

<h2 id="resources">Resources</h2>

<p><a href="https://openjdk.java.net/jeps/328">JEP 328: Flight Recorder</a></p>

<p><a href="https://openjdk.java.net/jeps/349">JEP 349: JFR Event Streaming</a></p>

<p><a href="https://bugs.openjdk.java.net/browse/JDK-8253898">CSR for JFR: Remote Recording Stream</a></p>

<p><a href="https://docs.oracle.com/en/java/javase/16/docs/api/jdk.management.jfr/jdk/management/jfr/RemoteRecordingStream.html">Javadoc RemoteRecordingStream</a></p>

<p><a href="https://docs.oracle.com/en/java/javase/16/docs/api/jdk.jfr/jdk/jfr/consumer/MetadataEvent.html">Javadoc MetadataEvent</a></p>

<p><a href="https://github.com/flight-recorder/health-report">Health Report</a></p>]]></content><author><name>ErikGahlin</name></author><category term="JFR" /><category term="JDK 16" /><category term="Event Streaming" /><summary type="html"><![CDATA[Application monitoring tools have for a long time been able to fetch data continuously over the network using JMX. For example, the CPU load can be obtained from the OperatingSystemMXBean and visualized in JDK Mission Control. JFR provides richer data that is structured, for example stack traces and timestamped values, but until JDK 16 there hasn’t been a way to transfer this information over the network as it occurs.]]></summary><media:thumbnail xmlns:media="http://search.yahoo.com/mrss/" url="https://egahlin.github.io/assets/remote-streaming-architecture.png" /><media:content medium="image" url="https://egahlin.github.io/assets/remote-streaming-architecture.png" xmlns:media="http://search.yahoo.com/mrss/" /></entry></feed>